Exactly one month ago, the UK woke up to the news they had elected a hung parliament for the second time in three elections. For many forecasters including myself, this came as a surprise as I had been predicting a Conservative majority of 100 seats. In the event, the largest ever polling underestimate of the Labour vote was enough to see the Conservatives lose their majority.
At the beginning of my commentary on election night itself, I defined success for my forecasts as being how close the number of Conservative seats was to my forecast of 375. I also stated that if the number of seats was in the 340s I would consider this to be a prediction error. The final outcome was 317 seats so clearly that is a major prediction error.
**Update 20th Sept 2025 – This post was originally published 9th July 2017. It remains one of my most important posts but it did contain some graphics which were unreadable in some formats and some typos so I’ve edited this post to correct these issues. I’ve also updated the text format to my current style guide and taken the opportunity to add links to subsequent posts which reinforce particular points made in this article. Any new links are pointed out**
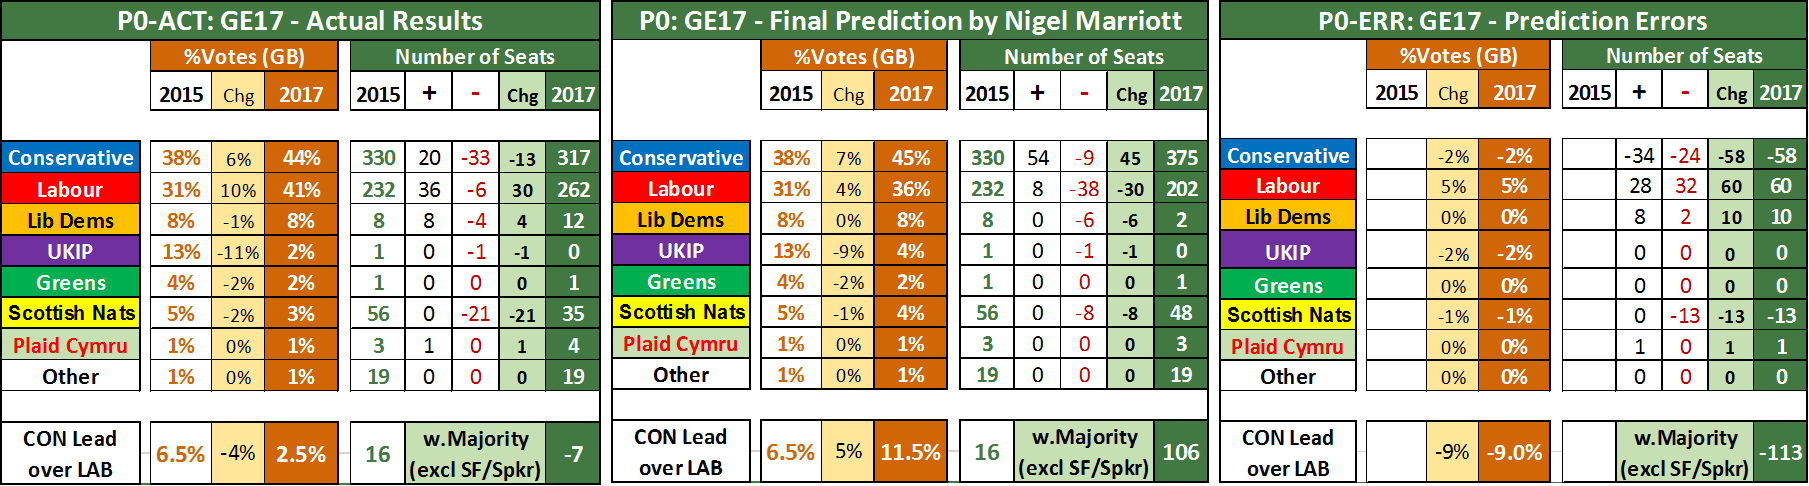
NB: Some people count the Speaker as a Conservative giving the Tories 318 seats but I follow the House of Commons convention and count him as Other.
So why was my forecast so far out? To answer, I am going to start by considering some fundamental principles of forecasting. A prediction consists of two parts:
- A set of INPUTS which are thought to be predictors
- A MODEL which converts the inputs into a prediction
For your prediction to be right, you need to have the right inputs and the right model. If either is wrong, then your prediction will be wrong. If both are wrong, you can sometimes end up with the right prediction by accident (through one error cancelling the other error) but normally your prediction error will be even worse.
**Update 20th Sept 2025 – the scenario of wrong inputs + wrong model = right prediction is exactly what happened to me with my 2024 UK General Election forecast! See GE2017 section here for more details but the model error was a result of parameter error as explained below**
Prediction ERROR can come from 4 sources either singly or combined:-
- INPUT ERROR – The inputs you use in your model turn out to be incorrect.
- MODEL ERROR – The model you have used to turn inputs into predictions is incorrect.
- PARAMETER ERROR – The model you have used is the right one but the parameters in the model are incorrect.
- RESIDUAL ERROR – You have the right model & inputs but what your model does not take into account results in an error.
Let’s list the potential sources of error in my 2017 general election forecast.
- Input Error – I only ever had access to publicly available data throughout the election campaign, namely the polls, previous election results and demographic information from the Census. Of these 3 inputs, two were known in advance (previous results and demographics) but voting intentions were subject to potential polling error.
- Model Error – My model was based on 3 main assumptions which were; uniform national swing would not work as this was a realignment election, the Leave vote in 2016 would be the main driver of the Conservative and tactical voting against the Conservatives would take place. If any of these did not happen then I run the risk of having the wrong model.
- Parameter Error – In my model, there were two key parameters; how to account for the Leave vote in 2016 and how to reallocate the Green and UKIP votes in the seats where these parties had stood down. I used the opinion polls to help estimate these parameters. In addition, I had a parameter for an expected polling error based on historical errors in the polls.
- Residual Error – No model is ever perfect so residual error will always be present in a prediction. The question is whether what you failed to take into account has a significant effect on the results. Two factors that emerged during the election that I did not take into account was the increase in voter registrations and suggestions that young people would be much more likely to vote this time than in previous elections.
It turned out that input error was by far and away the largest contributor to my prediction error followed by my assumption of a polling error in favour of the Conservatives. This was simple to detect with hindsight. As some readers of my election blogs may recall, one of the key inputs to my model was the regional vote swings as indicated by the polls. 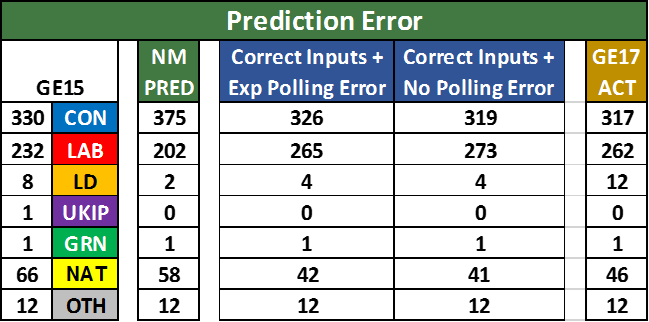 What I did was to substitute the estimated swings in each region based on the polls with the actual swings seen on June 8th and then rerun my model. In effect, I was asking myself “what if the polls had got each region spot on, how much would my forecast have changed?“. The outcome is shown in the table in the blue columns.
Two blue columns are shown. The first one is what my model would have predicted had the polls been bang on but I still included my expected polling error of a 2.6% underestimate in the CON–LAB lead. The second blue column takes out my expected poll error. Straightaway, you can see that my predicted number of seats for the Conservatives would have been more or less bang on. Yes other parties are not so well forecast but my main criteria of success was the number of Conservative seats.
The polling error of 2017 is responsible for 56 of the 58 seat error I made for the Conservatives. I have already looked at this at the national level in a separate post but it is worth looking at it again, this time at a regional level. If we do this, a striking picture emerges.

I find this chart utterly galling. The basic premise of my prediction (and many other forecasters) is the Conservatives would hold or even lose a few seats in the South and make significant gains in the North & Midlands which voted heavily for Leave in 2016. The polls actually got the South and Scotland right (any error less than +/-3% has to be marked as correct) but in the North, Midlands and Wales, the Labour vote was significantly underestimated. Labour was also underestimated in London but I am not overly bothered about this as London was an area where I was unsure if polls could fully capture the extent of potential tactical voting.
It is worth showing the predicted and actual swings by region to see where these errors came from. The top chart below is the actual swings, the bottom chart is the expected swings.
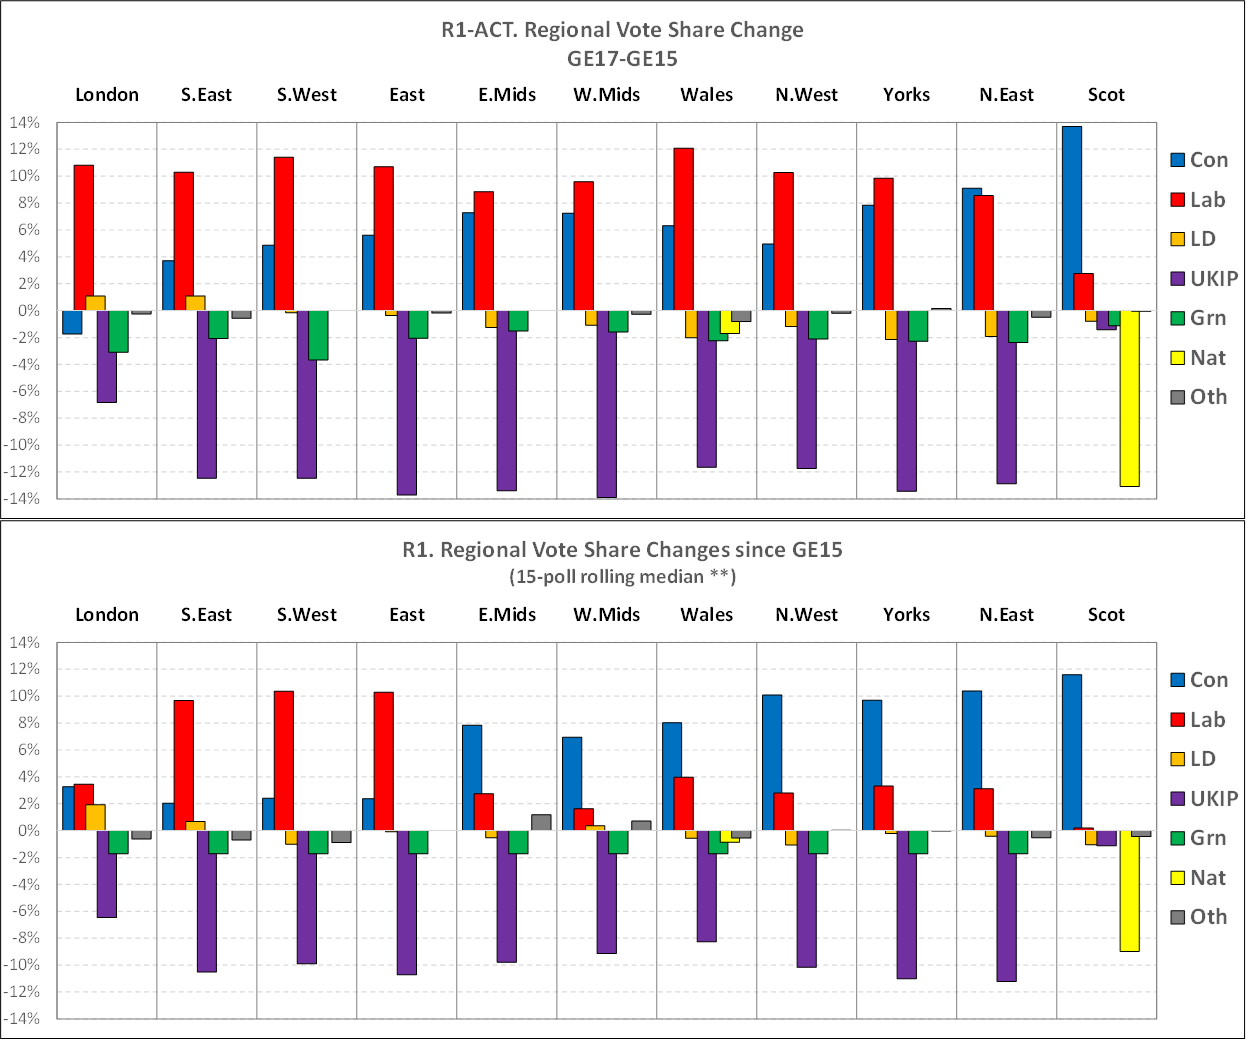
In some ways, these charts further confirm I had the right model but the wrong inputs. In the South & Scotland where the polls were right, I predicted the Conservatives would make a net gain of 3 seats which was very close to the actual result of 0 net gains. In London, Wales, Midlands & North, I was predicting net gains of 42 seats for the Conservatives and the final outcome was a net loss of 13 seats. The above two charts explain why this happened very clearly. In the Midlands and North, the polls showed the Conservatives making larger gains than Labour which would deliver many gains. In reality, Labour managed to match or exceed the Conservative gains and thus denied them their expected gains. Why this has happened is something I will be investigating in more detail in a later post but as I say, I find it very galling the polls should get it wrong in precisely the areas where I expected the Conservatives to make their gains.
**Update 20th Sept 2025 – In this X/Twitter thread in 2019, I showed the Conservatives did not gain from UKIP standing down their candidate in some seats. UKIP15 voters who were left without the option to vote for a UKIP17 candidate split their vote 50:50 between CON17 & LAB17.**
I can’t claim my model was perfect but it was clearly good enough to capture the essential dynamic of the 2017 election and would have been right but for better polling data. As an independent statistician I have no access to any data other than what is in the public domain. The best I can do is try to estimate if the polls will be right or wrong and if so, how? In 2015, I correctly said the polls would underestimate the Conservatives and I expected the same to happen to a lesser extent in 2017. In fact the opposite happened but at the beginning of May, I did state that there was a 25% chance of a polling error favouring Labour. I even went as far as saying that I would test a scenario assuming a polling error favouring Labour similar to that seen in 1983 (which I did do but in a different way than I expected) but what actually happened still exceeded that and did so in the worst possible way on a regional basis.
To make myself feel better, I am going to finish off by listing what I did get right!
- The threshold for the CON–LAB lead of +3% under which the Conservatives would lose their majority. The final CON–LAB lead in Britain was +2.5%.
- The net gain in seats for the Conservatives in the regions the polls got right i.e. South & Scotland. The result was 0 net gain compared to my prediction of +3 seats.
- The turnout of 68.8%. My prediction was for turnout to be 1/3 along the gap between the 2015 General election of 66.3% and the EU referendum of 72.2%.
- The election would be a realignment election with the Conservatives winning the working class vote for the first time ever.
- The Leave vote would be the driver of the Conservative vote.
The last point is an interesting one I want to demonstrate further though yet again, it reveals my frustration with the polls. In my widely read post “5 steps to making sense of the polls” I  showed this chart to demonstrate the effect of the Leave vote on the CON–LAB lead. I stated at the time I was uncertain about London and trusted the green line relationship more. This indicated an elasticity of +0.62 between the Leave vote and the CON–LAB lead which backed up an earlier analysis which indicated an elasticity of +0.7. Now we know the results, I can update the chart with known data for each region as follows.
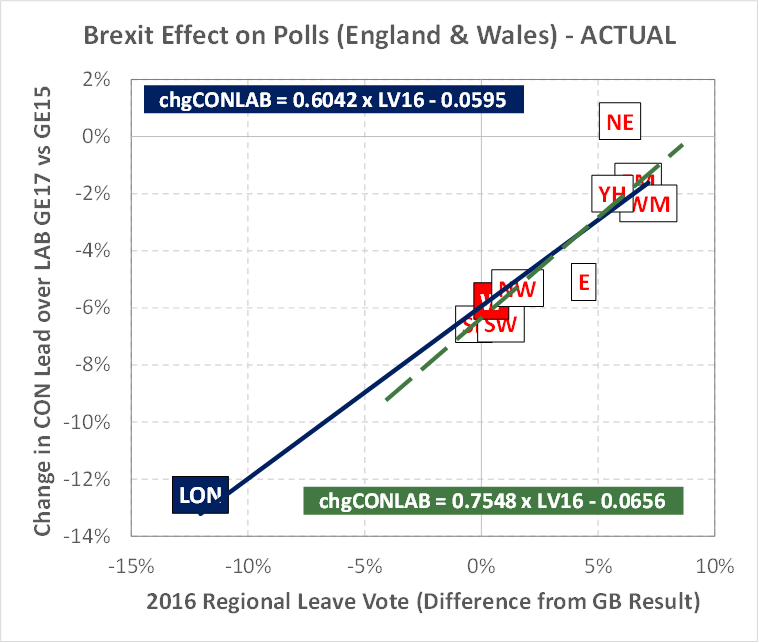
Two things immediately stand out. The first is my original inference of an elasticity in the range +0.6 to +0.7 was correct though the constant in the equation is lower due to the Labour vote being underestimated. Secondly, the relationship with the actual data is extremely good (R-Squared +0.88).
The second point is quite startling as it implies my earlier version of this chart held within it a clue the polls were overestimating the CON–LAB lead in the North & Midlands (labels were above the fitted line) and underestimating it in the South (labels were below the fitted line)! If I had extrapolated the dashed green line for London (given my uncertainty about London) I would have also predicted the overestimate in London. So without knowing it, I had some clues at the time which could have helped me predict some of the polling errors. But at the same time, this also confirms the essential correctness of my model.
As a matter of balance, I should state that I incorrectly predicted that the Lib Dems would lose seats whereas in fact they gained seats. Interestingly, I did predict 3 of the 4 seats which they lost including Nick Clegg’s defeat (I failed to predict Ceredigion) and at various times during the election campaign, my models were predicting 5 of the 8 gains they made including my own seat of Bath. Similarly, my models did predict at various times the Lib Dems could hold onto North Norfolk and Carshalton & Wallington which they ended up doing. In some respects, my final forecast for the Lib Dems was more a function of when the music stopped but it is also true my model underestimated the extent to which Labour voters would vote tactically for Lib Dems in some seats.
As a statistician with over 25 years experience of making forecasts in a wide variety of industries, I have long since learned not to agonise too much over my errors or over-celebrate my successes. I have always viewed any forecast as an opportunity to learn about how to do things better in the future. Saying all that, I will confess to being quite frustrated with this prediction. I put in a lot of time and effort to ensure I applied the lessons of previous forecasts and to find that I got so much right in the 2017 general election only to be let down by the one thing outside of my control is a kick to the guts.
