Be careful of what you wish for! Two weeks ago, I said I was hoping for an error in my predictions based on World Rugby’s rankings and I finally got one and it was Scotland overturning my team England …
World Rugby’s goal is that rankings can be used as a predictive tool. The idea is to take each team’s current ranking and add 3 points to teams playing at home. Whoever has the higher ranking is 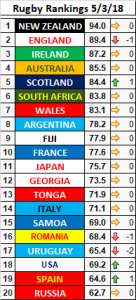 then expected to win but the closer the rankings, the closer the game is expected to be. The current World Rugby rankings as of 5th March 2018 is shown to the right along with their ranking points and the change (if any) from the previous week.
So far, my success rate is 35 correct predictions out of 43 matches involving 6 Nations teams in the 2017 & 2018 6 Nations and the 2017 Autumn Internationals broken down as follows:-
- Where the ranking gap was less than 3 points – Out of 11 matches, 7 were correctly called.
- Where the ranking gap was between 3 & 6 points – Out of 11 matches, 7 were correctly called.
- Where the ranking gap was 7 points or more – out of 21 matches, all were correctly called.
These figures are 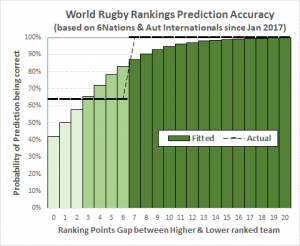 shown by the black line in the next chart. What I did here was build a logistic regression model to estimate the probability that the prediction would be correct given a certain ranking gap and this shown by the green bars (shaded differently for each of the 3 groups above). Such a model allows me to add an additional feature to my predictions, the chances of my predictions being correct.
You can see these probabilities in the next table (PROB column) which lists my predictions for the 2018 6 Nations along with actual results. As of now, it is only week 4 that can be counted as a true prediction with the other weeks treated as indicative for now. This is because World Rugby will update the ranking points after each week which of course will lead to different predictions.
Looking back at the accuracy of my predictions, it does appear that the threshold for accuracy is a ranking gap of 7 points. Above, my predictions are perfect, belo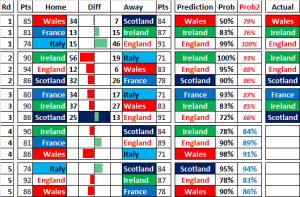 w that I am right 2 out 3 times. This suggests that the figures in the PROB column based on the fitted green bars may not be the best model. Now that I have 43 matches to look at, I decided to look at the correlation between the ranking gap and the actual gap in the scores. The scatter plot below shows the ranking gap for the stronger team on the horizontal axis and the difference in actual scores between the stronger and weaker
 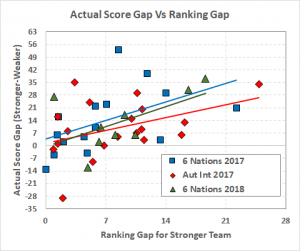 teams on the vertical axis. Doing it this way, means that a negative score is representing a prediction error.
I have highlighted the 3 tournaments separately and added a line of best fit for each. You can see that both 6 nations are very similar whilst the line for Autumn Internationals is a little flatter suggesting that large ranking gaps result in smaller score gaps than in the 6 Nations. I explored this further by building a multivariate regression model and I discovered that the more important factor is whether the stronger team is playing at home or away.
As the next chart shows, the difference is quite stark. When playing at home, stronger teams with a small ranking gap are expected to have a score gap of at least 10 points but if they are playing very weak teams, the expected score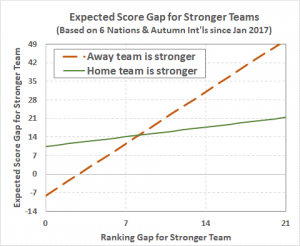 gap is not notably higher. However, when the stronger team plays away with a small ranking gap, the expected score gap is actually negative i.e. the weaker home team is expected to win. Conversely when the ranking gap is large for the stronger away team, they are expected to really put teams away.
This alternative model does make some sense to me. There has been quite a bit of talk recently that home advantage is becoming more important in the 6 Nations and this chart would appear to confirm that especially when a slightly weaker team plays at home. When the stronger team plays at home, it looks like they are a banker to win but can struggle to put away the weaker teams, perhaps because of high expectations that are difficult to deliver. I have added win probabilities for the stronger team using this model in the PROB2 column in the table above. Note the 3 completed weeks are shown in red since those matches were used to build the model whereas the blue figures are true predictions.
For week 4, there is not much difference between the two models for all matches. If you are a Scottish fan, the new model suggests that beating Ireland will be harder than first thought. For English fans, the odds are very much in their favour against France and it is probably a question of how much their confidence has taken a knock following the defeat to Scotland. For Wales V Italy, the new model gives Italy a higher chance of an upset but it is still unlikely.
Scotland’s win over England means that Ireland are now favourites to win the 6 Nations even though England are expected to beat Ireland in the last round of matches. This would mean both teams having the same wi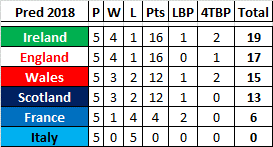 n/loss record with bonus points making the difference. An advantage of the new expected score gap model is that this could be used to predict losing bonus points. I have not yet done this and I am sticking to my current model of giving a losing bonus point to the weaker where the ranking gap is less than 7 points and a 4 try bonus point to the stronger team where the ranking gap is greater than 14 points.
