The deadline for employers to submit their 2025 gender pay gap data has now passed. So what do the numbers tell us about what happened in 2025? How have these changed since 2024 and 2017 when employer gender pay gap reporting (GPGR) became mandatory? Read on to find out the answers and why I have concerns about the government’s plans to make it mandatory for employer to publish action plans to reduce their gender pay gaps.
Where to find the latest data for employers
Section 78 of the Equality Act 2010 requires these employers to submit their gender pay gap data to the government portal here.
- All private sector employers in Great Britain with a headcount of 250 or more.
- All public sector employers in England with a headcount of 250 or more.
These are what I will call Mandated Employers. Some Voluntary Employers also choose to submit their data. These include Scottish & Welsh public sector employers, Northern Irish employers and British private sector employers with headcounts under 250. The last category is easy to identify in the government database but as yet, but the first three categories are not flagged separately. For now, only the last category are recorded as voluntary employers with the first three categories recorded as mandatory employers.
I have downloaded all employer data since 2017 (mandated & voluntary) for 15,491 legal entities as of 5th April 2026. I’ve made this available to you via this Microsoft Excel spreadsheet Gender Pay Gap Data & Chart Tool – 2026 v6.0. You can find more information about my spreadsheet here.
The specific calculations employers must submit are here. From April 2027 (subject to parliament amending section 78 of the Equality Act), mandated employers will also have to submit the same calculations for their ethnicity and disability pay gaps. A link to the government’s proposals and my thoughts on these can be found here.
How many employers submitted 2025 snapshot data?
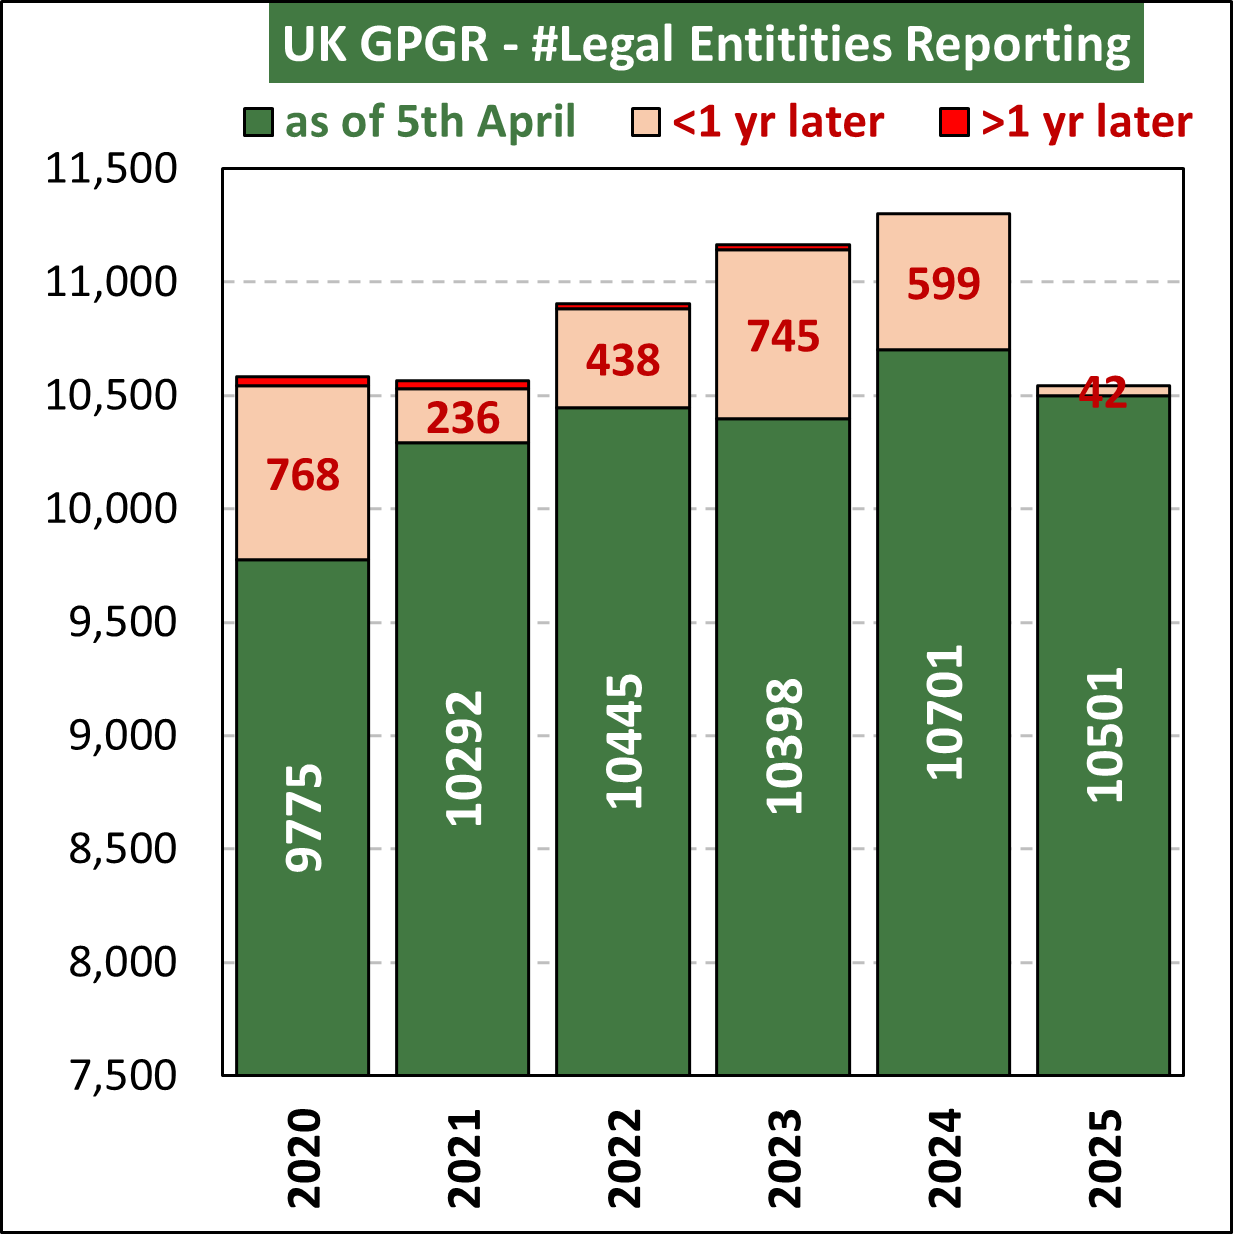 10,543 legal entities submitted data but some have inadvertently reported data twice for the same legal entities. Where I identify such duplicates, they are deleted from my downloadable spreadsheet noted in the previous section. From now on, I do not count these duplicates and so you may see some discrepancies between the chart to the left and later charts and tables.
So far, the number of legal entities submitting data is 200 lower than those submitting as of 5th April last year for the 2024 snapshot dates. Is this because there are 200 fewer employers available to report or did the Easter holiday straddling the deadline catch some employers out? 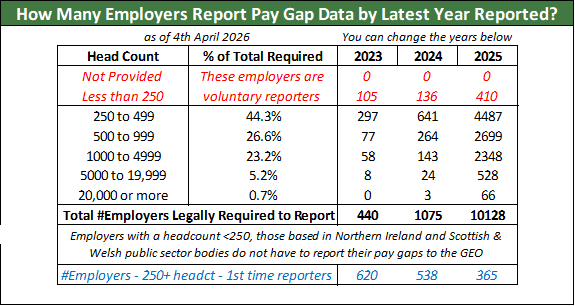 The table to the right shows there are 1075 employers who submitted 2024 snapshot data but who have not yet submitted 2025 data. We know from the 2023 column in this table that ~440 of these will not be submitting 2025 data due to them either going bust, merging with another legal entity or falling below the 250 headcount threshold. For now, I expect a further 600 to 800 employers to submit their 2025 snapshot data at some point over the next 12 months.
Of the 10,538 submissions for 2025 (after removal of duplicates), 410 were made by voluntary reporters. I will ignore these going forward and concentrate on the 10,128 mandated reporters as of 5th April 2026.
How many employers submitted incorrect data?
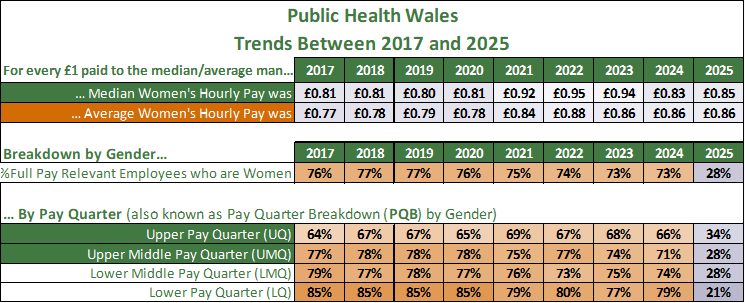
494 mandated employers submitted 2025 snapshot data with obvious mathematical errors. The most common error by far is what I call a flip error which is when either the pay quarters are entered the wrong way around, men are entered as women and vice versa or the pay gap is entered as favouring men when it should favour women and vice versa. I’ve explained flip errors on many occasions in the past and Public Health Wales are just one of the latest examples in 2025. As you can see, their 2025 submission states they flipped from a 73% female workforce in 2024 to a 72% male workforce in 2025 which is clearly nonsense. By the laws of maths, had this in fact happened, the median pay gap would be in favour of women rather than in favour of men as submitted.
From now on, I will ignore employers with suspect data and concentrate on the 9,635 mandated employers who submitted 2025 snapshot data with no obvious errors. However, in my experience, a further ~10% of these will have made errors in their data but these can only be detected with more detailed analysis. For example, I note Olleco entered men as women in their lower & lower middle pay quarters in 2025. Had they also made the same mistake with their upper and upper middle pay quarters, this would have been a full flip error that my algorithm would have flagged but the half flip error here is not yet part of my algorithm.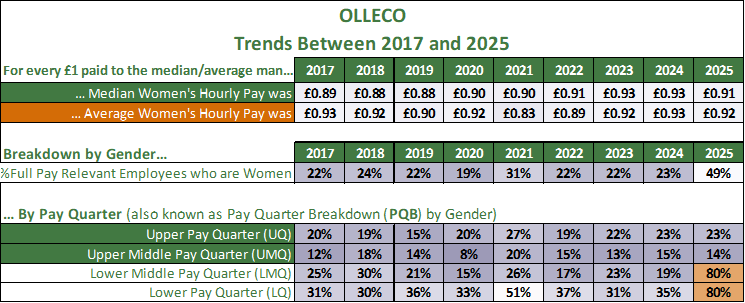
Median Gender Pay Gaps in 2025
When the 9,635 mandated employers with no obvious errors are sorted in order of their median gender pay gap, I find the median mandated employer (the 4818th employer) is the wholesaler TD Synnex UK Ltd. At this employer, for every £1 paid per hour to the median man on 5th April 2025, the median woman was paid 91.3p or 8.7% less.
However, the variation between employers in terms of their reported pay for their median woman is considerable as can be seen in this chart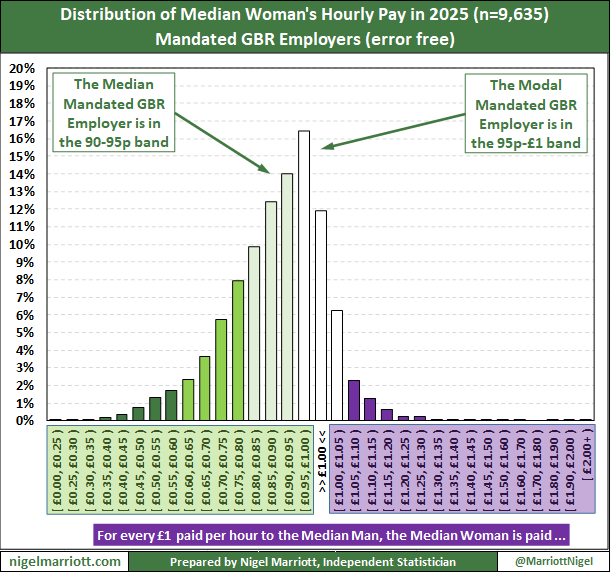 showing the distribution of median woman’s pay. The bars are colour coded as follows assuming the median man is paid £1 per hour –
- Dark Green – where the median woman is paid less than 60p
- Mid Green – where the median woman is paid between 60p & 79p.
- Light Green – where the median woman is paid between 80p & 94p
- White – where the median woman is paid between 95p & £1.04
- Purple – where the median woman is paid £1.05 or more
I will reuse this colour scheme in my charts and tables going forward.
I have pointed out on many occasions that one cannot look at pay gaps in isolation. You must also look at the gender ratios of employees both overall and within pay quarters/pay bands. My most recent article on this point is “33 London Councils – We are One“. I demonstrated what looks like 33 employers with different pay gaps are in fact 33 clones of the same employer who are following different service delivery strategies.
The chart below captures some of the points I made in that article. In the top bar, 34% of those submitting pay gap data for 2025 essentially had no pay gap as their median woman was being paid close to what the median man was being paid. 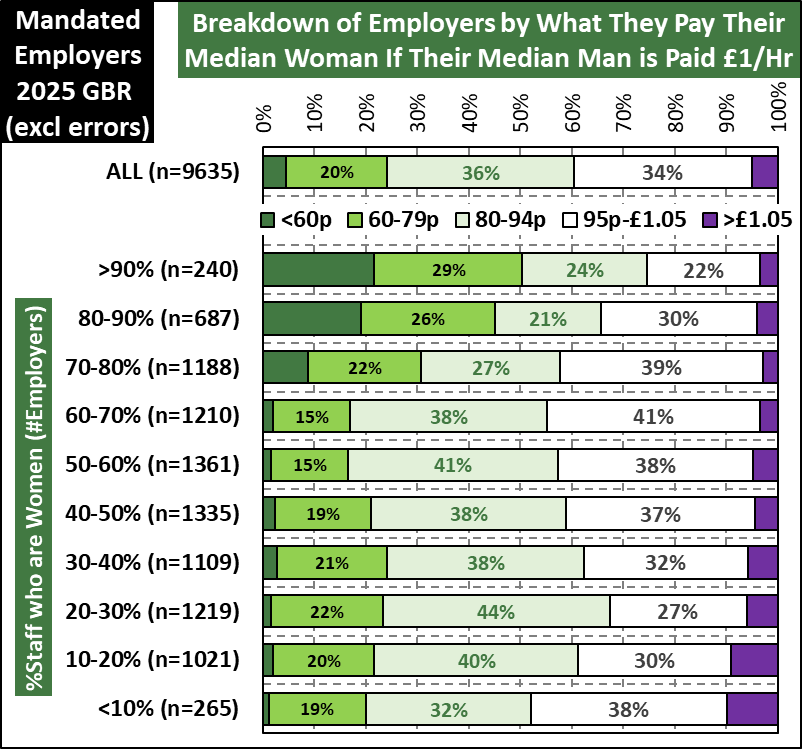 Just under a quarter of employers pay their median woman less than 80p for every £1 paid to the median man as shown by the two darker green bars which I will regard as “large” pay gaps in this article.
The chart then splits employers by the proportion of staff who are women. Here, we see a notable pattern which has occurred in every year since 2017. When women make up less than 70% of the workforce, around 20% of employers have “large” pay gaps i.e. they are paying their median woman less than 80p. But when women make up more than 70% of the workforce, up to 50% of employers pay their median woman less than 80p. In other words, when women dominate the workforce, pay gaps are twice as likely to be “large” pay gaps than when women do not dominate the workforce.
It turns out this feature is sector dependent and does not appear in every sector. I first explored this in more depth in my article “Why do female dominated public sector employers gender pay gaps so large?” which is based on 2021 snapshot data. Splitting employers into public sector and private sector is straightforward to do since public sector data is based on a snapshot date of 31st March whilst the private sector uses 5th April as their snapshot date.
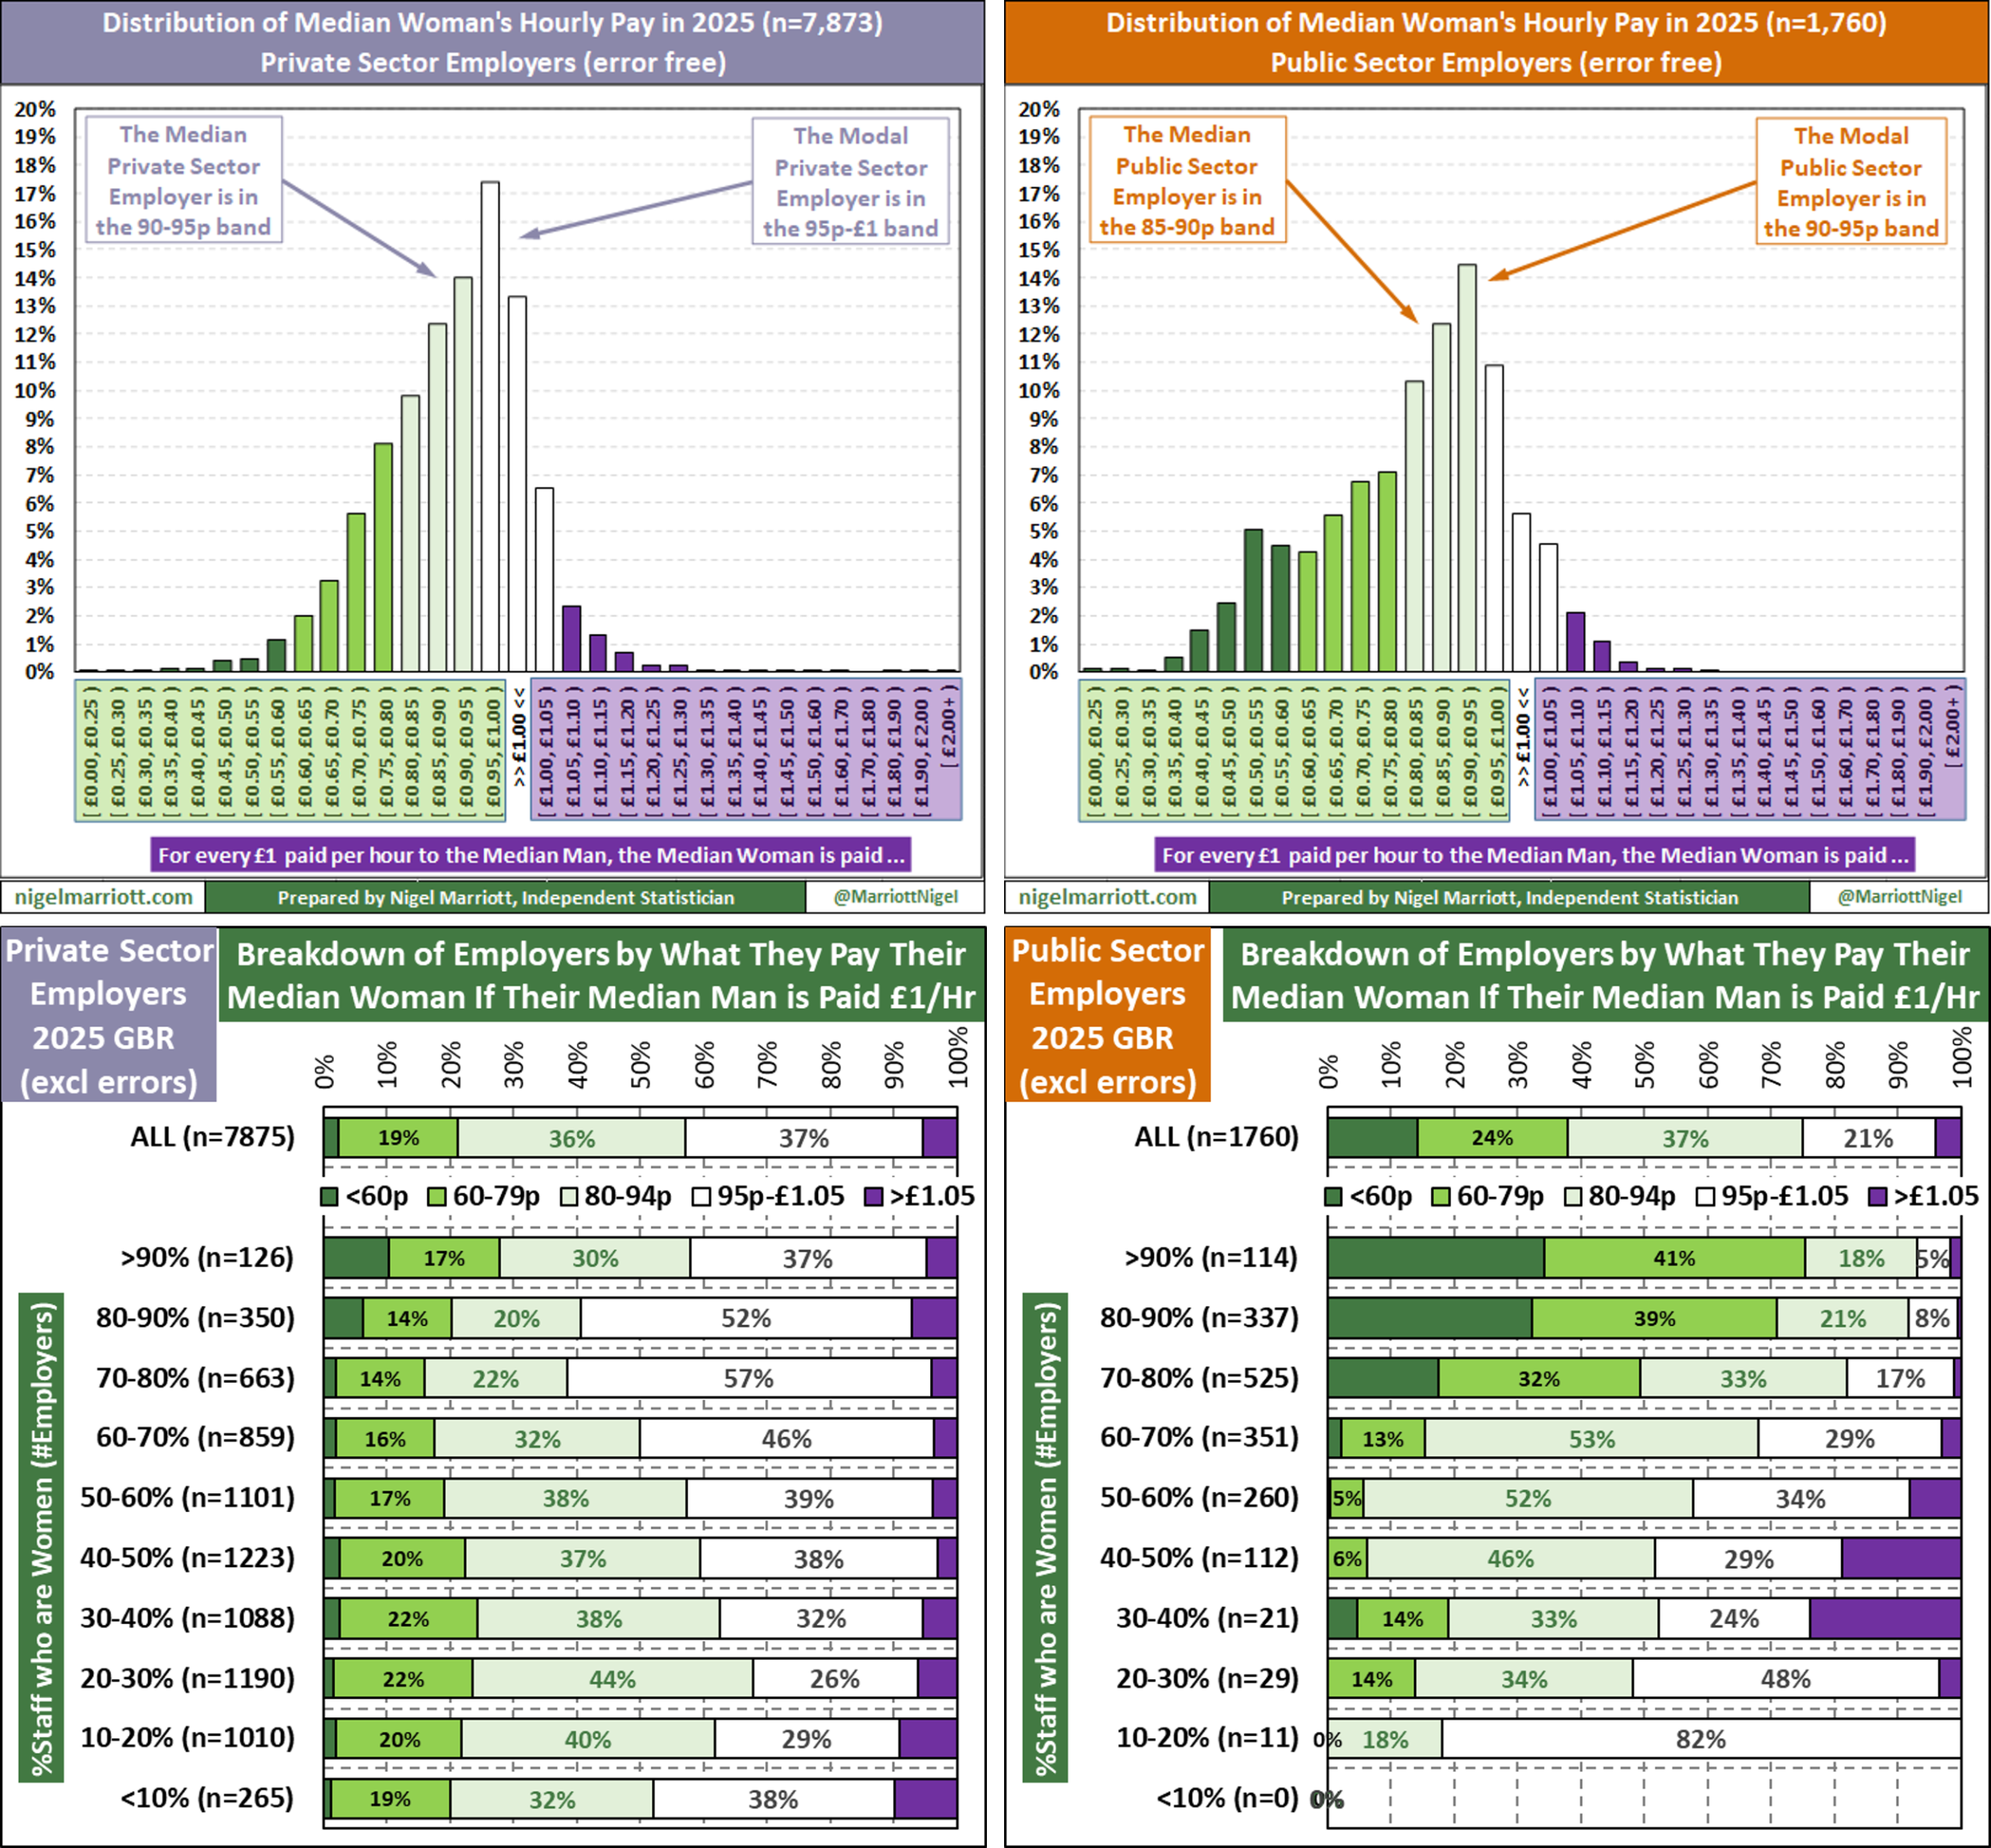
To round off this section, here is a summary of the differences between the public and private sector employers when looking at their 2025 snapshot data.
- 7875 legal entities submitted data using the private sector snapshot date.
- 1760 legal entities submitted data using the public sector snapshot date.
- When sorted by headcount, I estimate the median private sector legal entity has ~550 employees.
- When sorted by headcount, I estimate the median public sector legal entity has ~850 employees.
- When sorted by median pay gap, the median reporting private sector legal entity is Nationwide Windows Limited who pay their median woman 7.6% less than their median man.
- When sorted by median pay gap, the median reporting public sector legal entity is New Bridge Multi-Academy Trust who pay their median woman 14.3% less than their median man.
- 39% of private sector legal entities have majority female workforces (see chart below).
- 90% of public sector legal entities have majority female workforces (see chart below).
Below are the same charts as above but separately for the public and private sectors. The differences between these two sectors is very noticeable.
For information, further divisions of employers into industry sectors is possible since the government database is linked to Companies House data where employers can specify their sector using SIC (Standard Industry Classification) codes. However, in my experience, too many employers are misclassified for these SIC codes to be sufficiently reliable. I expanded on this point when giving evidence to the Treasury Select Committee in 2019 on the “Effectiveness of Gender Pay Gap Reporting”. I still recall the committee members looking at each other when I listed a number of employers who were obviously misclassified.
Did the gender pay gap narrow in 2025
Yes it did but we didn’t need any employer data to know this. The Office of National Statistics (ONS) stated in October last year that for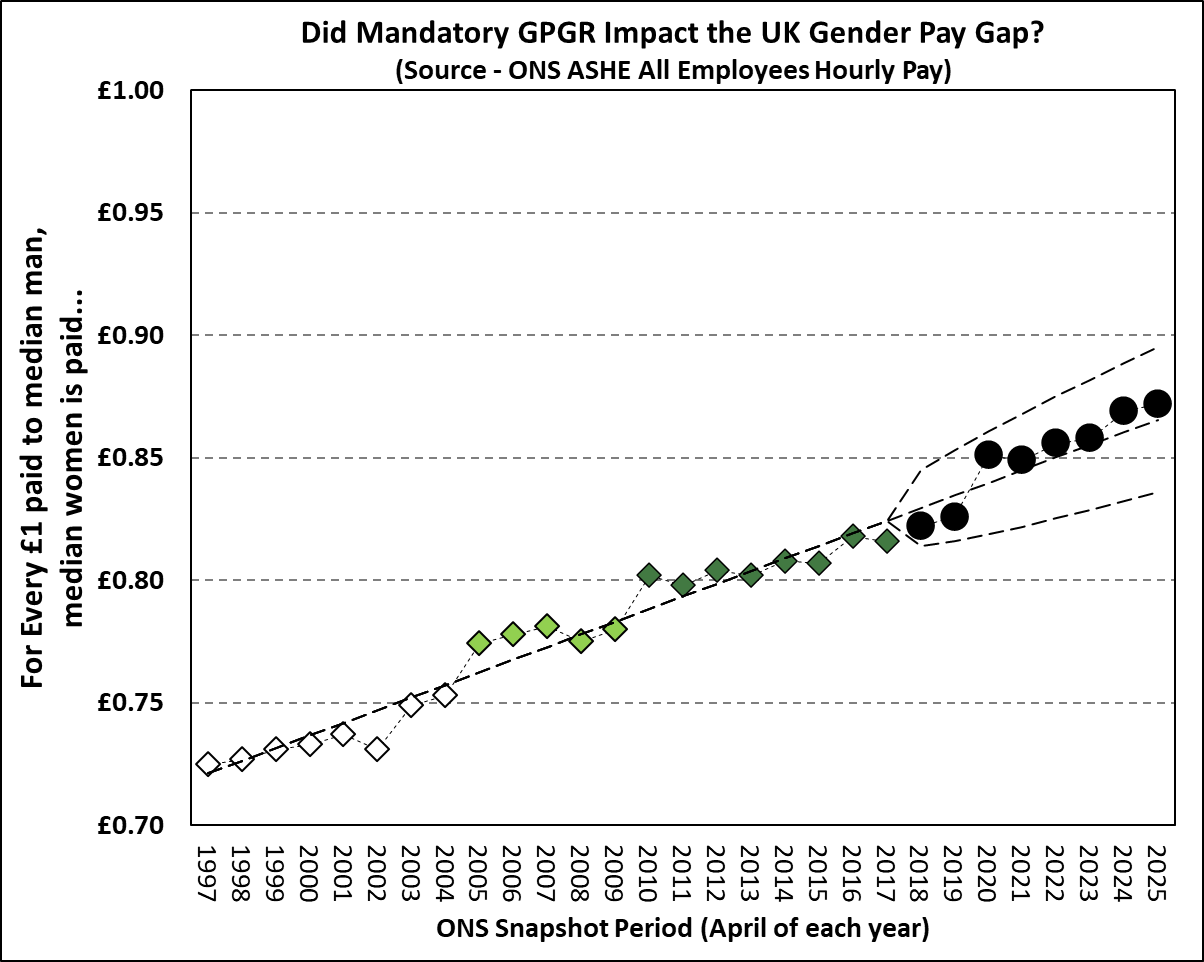 every £1 paid per hour to the median man across the whole of UK in April 2025, the median woman was paid 87.2p or 12.8% less. The UK national pay gap has narrowed at the rate of 0.5p per year since 1997, a trend which has not changed since the introduction of mandatory gender pay gap reporting for employers in 2017. For more details on ONS gender pay gap estimates, please read my article “When is equal pay day in 2024?”
It is not possible to use employer level GPGR data to estimate the national gender pay gap though you 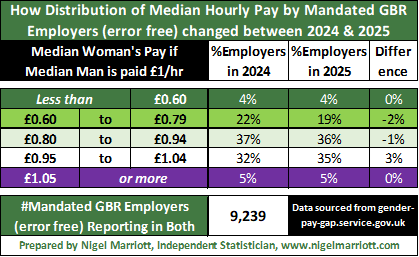 will find plenty of idiots on social media who try to do this! What we can do instead is see how the distribution of pay gaps across employers has changed from year to year.
The table to the right looks at the 9,239 mandated employers who submitted data in both 2024 and 2025 without obvious errors. In 2025, 35% of employers effectively had no gender pay gap (white row) compared to 32% in 2024. The proportion of employers with “large” pay gaps (where the median woman is paid less than 80p) fell from 26% to 23%. For some people, this represents progress but as I discuss in the next section, we can’t be sure this represents true progress to gender equality.
What about the longer term trend since 2017? In my article “Are we there yet?” I explained why I prefer to split employers into three groups for each year as follows –
- Those whose median gender pay gap was smaller than the previous year
- Those whose median gender pay gap was the same as the previous year
- Those whose median gender pay gap was larger than the previous year
I then track the difference in the percentage of employers with smaller pay gaps and the percentage with larger pay gaps. In 2025, 51% reported smaller pay gaps than 2024, 8% unchanged pay gaps and 41% larger pay gaps than 2024. The net difference between smaller and larger pay gaps is +10%.
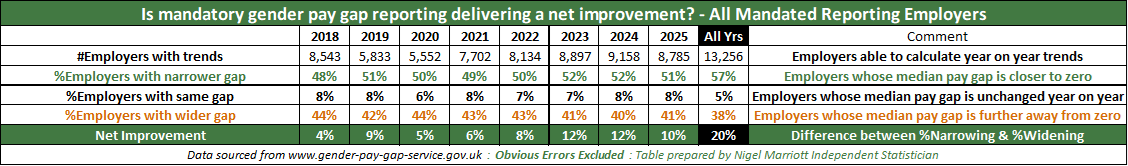
The All Years column highlighted in black shows the same calculations but this time between the first year an employer started reporting and the latest year they’ve reported for. Overall, 57% of employers are now reporting a smaller pay gap since they started reporting and 38% are reporting a larger pay gap. Again, this might look like progress to gender equality on the surface but there is an important caveat to make which I cover in the next section.
What can we learn from the 2025 numbers?
If you are new to the details of gender pay gap reporting, then I hope you found the above informative. For myself, the data is not particularly illuminating because I spent too much time looking at the wrong statistics, namely the gender pay gap itself.
To truly learn from employer gender pay gap submissions, you first have to answer the questions I’ve listed below. Each question is one I have explored in an article as linked –
- What does gender equality mean to an employer?
- This articles describes 6 possible definitions of gender equality
- No pay gap is just one of these
- It includes interesting data on the gender differences between the public and private sector.
- Which metrics should we track to see if we are approaching gender equality?
- For nearly all definitions of gender equality, the relevant metrics will be found in the pay quarter breakdowns employer have to report on, not the mean or median gender pay gap statistic.
- This article describes my concept of a gender swap number which is one way of combining pay quarter information in a meaningful way.
- If no pay gap is our metric, how long will it take to close our pay gap?
- Using the gender swap number metric, I show for many employers it will take them up to 25 years to close their pay gaps.
- This assumes employers are not using illegal positive discrimination or seeking to game the system.
- Are employers gaming the system and/or engaging in illegal recruitment practices?
- The current GPGR system has flaws which can be exploited by unscrupulous employers which are detailed in the first link.
- The second link is the Royal Air Force’s report into the illegal positive discrimination scandal that came to light in 2023.
- The person responsible for the RAF scandal had clearly not read my article above which explained why closing a pay gap can take ~25 years i.e. a whole generation, not the 3 to 5 years timescale they were working to and to which their HR chief had made clear was not possible without breaching the Equality Act 2010.
I’ve written this list because the government has drafted legislation to amend section 78 of the Equality Act 2010 to add section 78A which would compel mandated employers to publish action plans to reduce their gender pay gaps. I have a number of concerns about this proposal but the main one is the government does not appear to have answered my first question which is to state their definition of gender equality. They have automatically assumed the answer is to have no gender pay gap but for a number of employers, this will not be an appropriate definition of gender equality. If compelled to work to the government’s definition, I fear the answer to my 4th question will be more employers gaming the system or engaging in illegal practices like the RAF when they find out it will take 25 years or more by following the law.
Gender Equality in action is not always about reducing pay gaps!
As an example of an employer with a different concept of gender equality, let’s look at Buro Happold Engineers Ltd who are headquartered in Bath where I live.
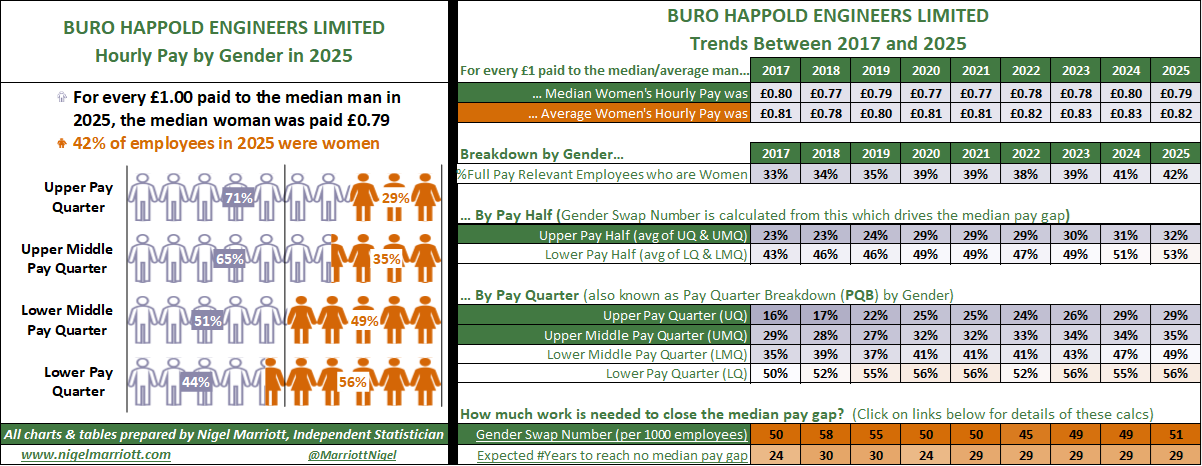
42% of their employees in 2025 are women. This is a notable change from 2017 when women made up 33% of their workforce. Over the years, it is clear they have steadily increased the number of women they employ. This is not an accident, their gender pay gap narrative makes it clear their definition of gender equality is about employing more women in all roles reflecting “efforts to address occupational segregation” and “continuous improvement … (to) building a business where everyone feels a sense of belonging.”
Do you agree with me that Buro Happold Engineers Ltd should be celebrated and championed as an example of gender equality in action? Or are you focusing on their gender pay gap which is unchanged from 2017 and may be subject to sanctions from the government if their proposals are enacted? Under the government’s definition of gender equality, Buro Happold’s are on the wrong track. The trends in their pay quarters clearly show why the pay gap is stable. It is because engineering is an industry which is not awash with female talent. Instead their efforts to attract women today are most likely to result in younger women being recruited into entry level roles in the lower pay quarter. Over time, if Buro Happold is a place where women feel like they belong, they will rise up the pay scale and be replaced by more women below them.
This is exactly what has happened but this does not change the pay of the median or average woman relative to the median or average man. Eventually it will once the lower pay quarters settle down into a presumably 50:50 men:women balance and the upper pay quarters start to become more female. But this is a change which will take another 25-30 years according to the calculation in the bottom row. According to the government, Buro Happold were wasting their time making engineering more attractive to women and should have prioritised the pay gap instead. Is this what gender equality looks like to you?
Are Buro Happold Engineers Ltd atypical?
No they are not. There are many employers for whom increasing the proportion of their workforce who are women is their priority. In many cases, the availability of female talent is such that recruitment of women will be in the lower pay quarters to begin with. This will have the effect of widening their pay gaps contrary to the government’s mandate to reduce them. If such employers decide to comply with the government mandate instead, often they will find this requires them to reduce the proportion of women in their workforce. In my experience, few employers are comfortable with making that decision.
One exception I did find was Pendle Education Trust whose pay gap narrative is well worth reading. 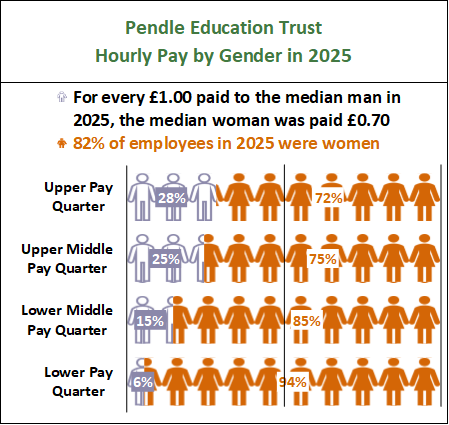 They pay their median woman 70p for every £1 paid to their median man. Whilst this is a large pay gap, it is by no means unusual among academy trusts especially among primary schools where the median woman is often paid less than 50p. This happens because teaching and non-teaching staff are on very different pay scales. Pendle’s median man is a teacher but their median woman is not. As their pay quarter breakdown for 2025 shows, men are almost absent from the lower paid (non-teaching) roles.
If you read their 2025 pay gap narrative, you will see them tentatively noting “To narrow the gap further we may need to explore how to encourage more men into support roles…” (emphasis is mine). It is rare to see an employer say something like this about men but instead of following this train of thought to its logical conclusion, which is their pay gap can only be reduced by making their non-teaching workforce less female, they immediately pivot to talking more about what they can do for women. Is this what gender equality looks like to you?
— Would you like to comment on this article? —-
Please do leave your comments on either of these LinkedIn or X/Twitter threads.
— Subscribe to my newsletter to receive more articles like this one! —-
If you would like to receive notifications from me of news, articles and offers relating to diversity & pay gaps, please click here to go to my Newsletter Subscription page and tick the Diversity category and other categories that may be of interest to you. You will be able to unsubscribe at anytime.
— Want to know more about pay gaps? —
You will find a full list of my pay gap & diversity related articles here which are grouped by theme.
— Can I help you to close your pay gap? —
I offer the following services to my clients who want to define, measure, analyse, improve & control their pay gaps.
- Analysis – I can dig deep into your data to identify the key drivers of your pay gaps. I can build a model using a large number of variables such as pay band, seniority, job function, location, etc and use this to identify the priority areas for closing your gaps.
- Training – I run training courses in basic statistics which are designed for non-statisticians such as people working in HR. The courses will show you how to perform the relevant calculations in Microsoft Excel, how to interpret what they mean for you and how to incorporate these in an action plan to close your gaps.
- Expert Witness – Has your gender pay gap data uncovered an issue resulting in legal action? Need an expert independent statistician who can testify whether the data supports or contradicts a claim of discrimination? I have experience of acting as an expert witness for either plaintiff or defendant and I know how to testify and explain complex data in simple language that can be easily understood by non-statisticians.
If you would like to have a no-obligation discussion about how I can help you, please do contact me.
