When is #EqualPayDay in the UK in 2026?
No-one knows is the correct answer. That’s because there are no national measurements of the extent of unequal pay in the UK e.g. a woman being paid less than a man for the doing the same job.
If you see anyone talking about “Equal Pay Day“, they are in fact talking about #GenderPayGapDay, the day on which the typical women “starts working for free” when compared with the typical man irrespective of what job they are doing. Of course, as everyone knows, gender pay gaps do not and cannot measure the extent of unequal pay in any shape or form.
For 2026, the ONS (Office of National Statistics) has published 30 different gender pay gap statistics. This means we could have 30 different gender pay gap days so how do we decide which one to use?
Where to find 30 gender pay gaps
ONS use their ASHE (Annual Survey of Hours and Earnings) to estimate pay by sex as of April 5th of each year. For more details on ASHE, please read my article “Are we there yet?”
These estimates are normally published at the end of October of each year in three places –
- Gender Pay Gap in the UK – this is an annual report showing some of the 30 pay gap statistics broken down by a variety of categories. The most common pay gap quoted is based on median hourly pay excluding overtime. However, this report only links to a data download for the pay gap percentages here, not the pay figures by sex used to calculate the pay gap.
- Pay & Hours Data by Sex – here you can download a zipped file of spreadsheets containing the data used to calculate the 30 provisional pay gap statistics in 2026 only. The same link also allows you to download separate zipped files for the provisional 2025 pay gap stats and the final revised 2025 pay gap stats and for earlier years going back to 1997.
- These files also show the Percentiles of the distributions of men and women’s pay which is data I have not yet made use of.
- Each pay/hours data file has an accompanying file showing the Coefficient of Variation (CV) for each estimate. The CV is the standard deviation of a measure divided by its average.
- Historical Pay & Hours Data by Sex – here you can download 1997 to 2026 time series of the data in link 2 above for most of the 30 pay gap statistics but unfortunately not for all of them.
- Where gaps appear, you will have to use link 2 above to download the final revised pay gap stats for each of the missing years.
- Note ONS have made some changes to their methodology in some years which could create some discontinuities. These are pointed out in the download.
All charts and tables in this article are based on Pay & Hours Data from link 2 above using provisional estimates for 2026 and revised estimates for 2025.
- For earlier versions of this article, please click on the relevant year – 2024, 2026
How did the ONS arrive at 30 pay gap statistics?
The 30 pay gaps are the outcome of every combination of these three factors –
- 2 Calculations – Median or Mean pay
- 3 Populations – Full-time, Part-Time or All employees
- 5 Pay Periods – Annual/Weekly/Hourly Gross pay or Weekly/Hourly pay excluding overtime
Each combination is calculated separately for men and woman plus for all employees resulting in 90 different estimates of pay as of April 2026. The ONS calculate the Pay Gap as the difference between the pay of men and the pay of women (Pay Difference or M-W) expressed as a percentage of the man’s pay i.e. (M-W)/M to arrive at the Gender Pay Gap (GPG). I am not a fan of this format and I prefer to calculate the Pay Ratio (W/M) by dividing the woman’s pay by the man’s pay. The pay ratio allows me to say for every £1 paid to the typical man, the typical woman is £x.yz.
10 Gender Pay Gap Days for ALL UK Employees in 2026
Here are the 10 calculations for All Employees in 2026. For information, ASHE does not include the self-employed and so the figures shown are intended to represent the estimated 29+ million employees in the UK. ONS estimate the ratio of men to women for this population is now 50:50.
The table shows first the five median pay estimates for men and women in blue followed by the five mean (or average) pay estimates for men and women in red. The pay ratio (W/M) and ONS gender pay gap (GPG) calculation is then shown followed by the date of Gender Pay Gap Day if those figures were used.
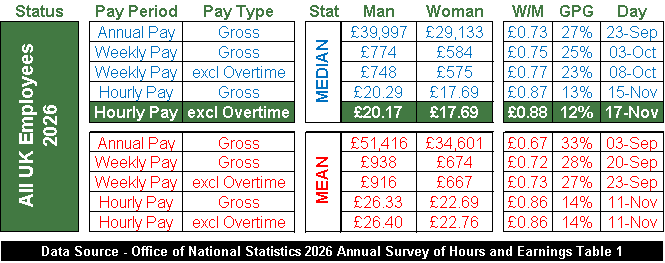
How is gender pay gap day calculated? 2026 was a normal year with 365 days so I first multiply 365 by the pay ratio W/M (women’s pay divided by man’s pay). This calculation is a variant on my pay ratio calculation whereby for every 365 days the man is paid, the woman is paid for Y days. I then add 1 day to get the date on which the typical woman “starts working for free“.
I will illustrate with the row highlighted in green in the table which uses median hourly pay excluding overtime. For every £1 paid to the median man in April 2026, the median woman was paid 88p or 12% less. The equates to 365 x 17.69 / 20.17 = 320.12 days into 2026 which turns out to be at 02:54 on 16th November. This is the date and time the median woman is “paid up to” which means the median woman “starts working for free” from the 17th November.
The reason I highlight that row is it’s the pay gap statistic which is normally quoted when pay gaps are discussed. That doesn’t make it the “official” or “right” statistic, it just happens to be the statistic which has become the default measure of pay gaps. Personally, I prefer to use median annual gross pay as the starting point of discussions about gender pay disparities since that pay gap (27% in 2026) is closer to capturing all the choices and constraints people face in establishing their pay.
10 Gender Pay Gap Days for FULL TIME Employees in 2026
Here are the 10 calculations for UK Full Time Employees in 2026. ONS define a full time employee as anyone whose contracted hours are 30 or more per week. ONS estimate there are 20.7 million people in paid full time employment with approximately 12.0 million men and 8.7 million women.
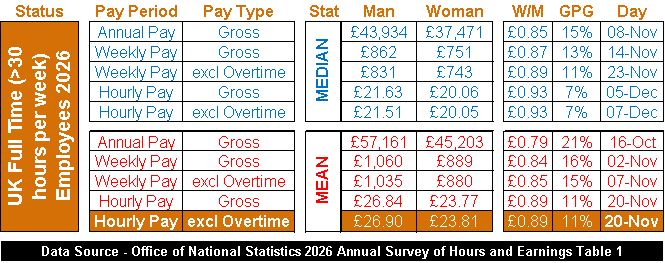
The highlighted row is what the Fawcett Society are choosing to use for their 2026 “Equal Pay Day” campaign. This raises the question as to why did they choose this statistic and not one of the other 29? The answer comes from their 2024 campaign. In a downloadable 15-page PDF report available from this link, they gave this justification halfway down on page 3 –
“Fawcett uses the mean hourly gender pay gap for full-time workers (11.3% in 2024) to calculate the date of Equal Pay Day because this figure captures the full impact of men being more likely to be very high earners.“
In other words, they decided to use a figure which maximises what they perceive the typical man to be earning. Personally, I would use the same justification to not use the mean. All statisticians will tell you the mean is susceptible to extreme outliers (Premier League football club pay gaps illustrate this perfectly). Whilst it has its place in statistical analysis, if one is trying to portray the “typical” man/woman when the underlying distribution of pay is known to be asymmetrical or skewed, the median is normally preferred to the mean. Indeed the Fawcett Society accepted this point two paragraphs on from the above quote in 2024 when they refer to median after tax monthly pay “… because this best reflects the tangible, average amount in the pockets of the typical woman or man.”
10 Gender Pay Gap Days for PART TIME Employees in 2026
Here are the 10 calculations for UK part time employees in 2024. ONS define a part time employee as anyone whose contracted hours are under 30 per week. ONS estimate there are 8.3 million people in paid part time employment with approximately 2.5 million men and 5.8 million women.
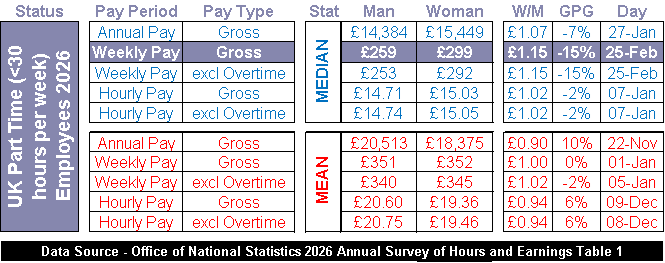
If there was a counterpart to the Fawcett Society who wished to choose a statistic to best highlight the plight of men, the highlighted row of the median gross weekly pay would be their best option. This shows the largest pay gap whereby for every £1 paid gross per week to the median part time man, the median part time woman is paid £1.15 or 15% more. Gender Pay Gap Day for this statistic is 25th February which now has the meaning that from the start of the year to the 24th February, the median part time man is “working for free” and only “starts to be paid” from the 25th February.
So When is Gender Pay Gap Day in 2026?
The answer should be obvious by now. If it is possible to have one gender pay gap day showing a disadvantage for women in November and another gender pay gap day showing a disadvantage for men in February, then perhaps the pay gap statistic is not telling you much in the first place. Regular readers of my blog will know I constantly bang on the need to analyse representation gaps and not pay gaps. The ONS pay gap statistics were designed by statisticians for statisticians and were never designed for intelligent conversations about gender disparities. Perhaps we should have 30 gender pay gap days each year just to drive this point home?
Did the Gender Pay Gap Widen in 2026?
Far from having 30 gender pay gap days each year, we could have a 100! This is because nearly everyone forgets the ONS pay gap estimate is just that, an estimate from a 1% sample of PAYE employees. This means the estimate is subject to sampling error. In other words, if ONS decided to select another 1% of PAYE records they would not get the same estimate of the pay gap. Based on the coefficient of variation information provided earlier in link 2, I calculate Gender Pay Gap Day for Full Time mean hourly pay excluding overtime could be anytime between the 18th & 22nd November.
Does this matter? It does if you are trying to work out if the gender pay gap has widened or narrowed in 2026. The table below shows the change in pay for men and women and the pay gap for all 30 pay gap statistics. Whilst it is a busy graphic with 30 tables, I will be concentrating on the mean full time hourly pay excluding overtime table which is in the bottom row, 4 tables along from the left.
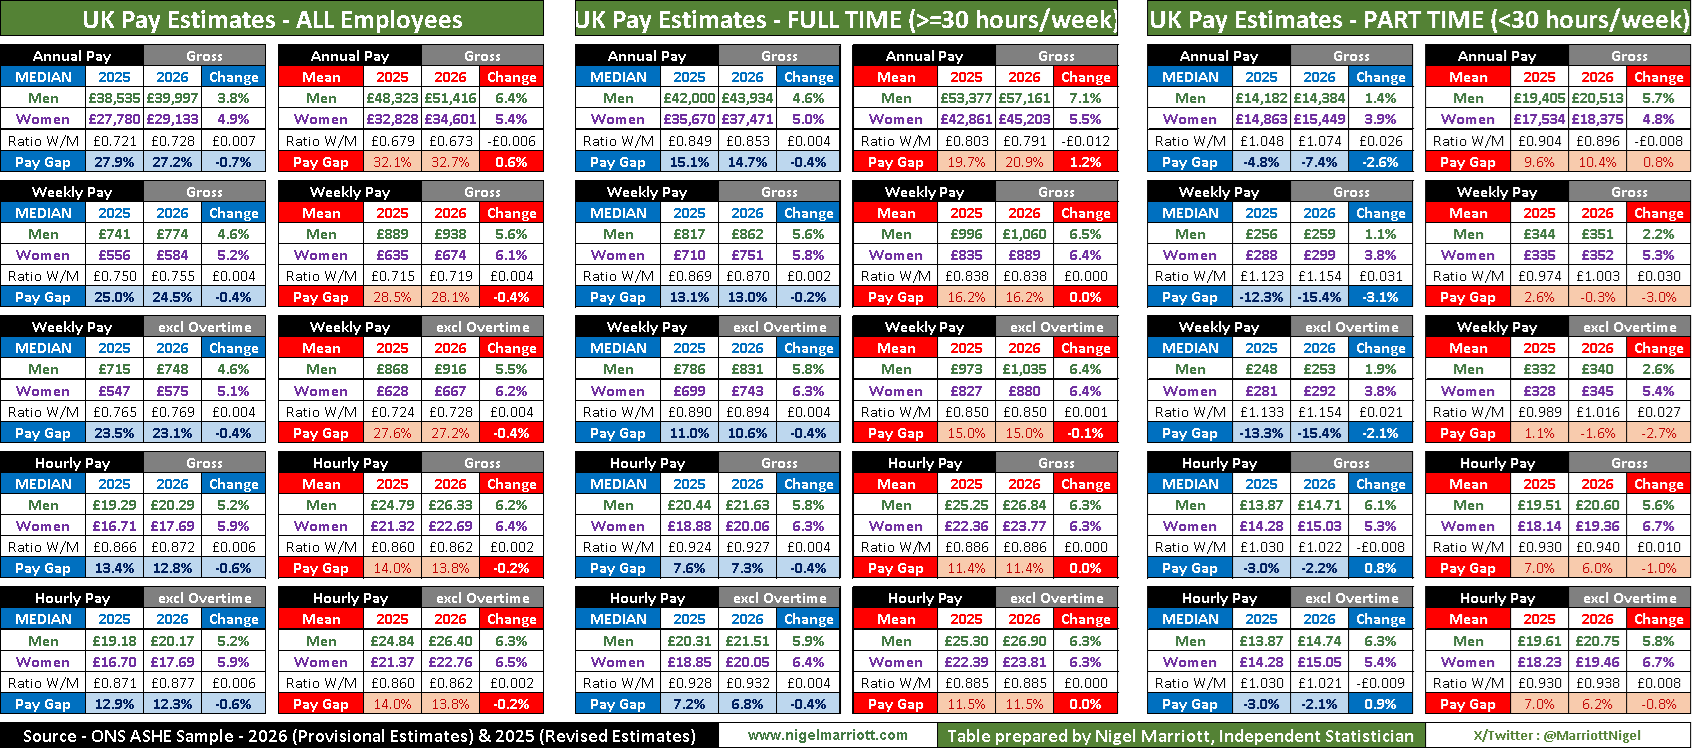
This shows the full time mean pay gap for hourly pay was unchanged in 2026 compared to 2025 at +11.5%. However, the Fawcett Society disagrees with me and states on their website (see earlier link in the full time section) and this LinkedIn post that “For the first time in five years, the gender pay gap has widened.” Specifically they note the pay gap went from 10.9% in 2025 to 11.5% in 2026 as can be seen in this screenshot of their website link –
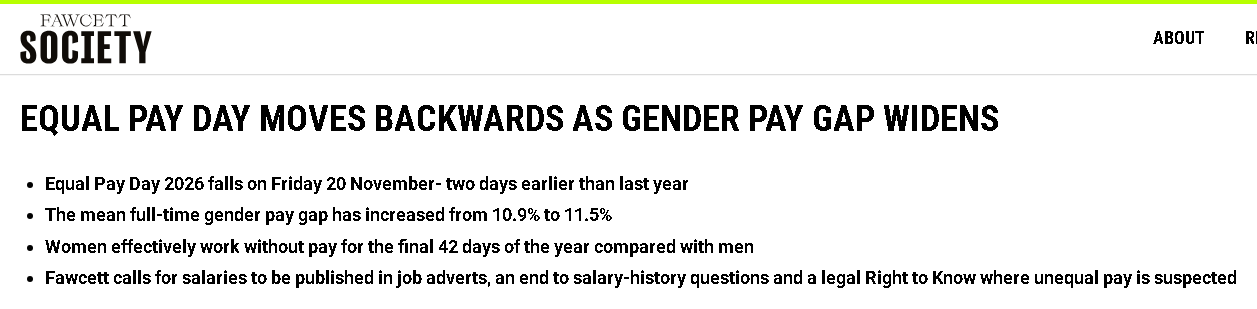
Where did they get 10.9% for 2025? The answer is this percentage is the provisional estimate ONS made in October 2025 for the full time pay gap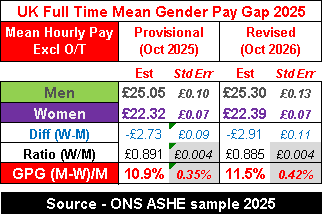 using mean hourly pay excluding overtime. In October 2026, ONS published their provisional estimates for 2026 AND revised estimates for 2025! You can see the differences between the provisional and revised 2025 estimates in this table. The average man’s hourly pay was revised up by 25p from £25.05 to £25.30 and the average woman’s hourly pay was revised up by 7p from £22.32 to £22.39. This explains why the average pay gap was revised up 0.6 percentage points. Somehow, the Fawcett Society has overlooked this revision.
Revisions such as these happen all the time with economic statistics published by ONS. This is because in order to publish a timely estimate of the pay gap, some of the information they require from employers & other sources have not yet arrived. By the time, they are ready with their provisional estimates for the following year, they will have complete data for the previous year, hence the revised estimates.
At first, this could be annoying and creates uncertainty. Indeed, over 10 years ago, ONS initially said the economy went into a double dip recession only to revise the “recession” away a few months later. However, as I noted at the start of this article with the various sources of data, ONS publish coefficient of variation data for all provisional (& revised) estimates. Specifically, in 2025, they stated the standard deviation of full time hourly pay excluding overtime was 0.4% of the mean for men and 0.3% of the mean for women. From these, I can calculate the Standard Error (Std Err) columns shown in the table above for all statistics including the pay gap. These would have told the Fawcett Society last year that revisions to the 2025 estimates on the scale that actually happened were entirely plausible.
Why? Because of the Central Limit Theorem which is one of the foundations of statistical theory. This tells us revisions equivalent to more than twice the standard errors can be expected to occur 1 in 20 times due to sampling error alone. In 2025, average women’s pay was revised upwards by 1.0 standard error whilst average men’s pay was revised upwards by 2.5 standard errors. At first, that might seem unlikely but remember, ONS publish 30 pay gap statistics which equates to 60 sex specific pay estimates. So one would expect on average 3 of those 60 pay estimates to be revised to the extent we see for men’s full time hourly pay.
The Fawcett Society might argue there is still sampling error in the revised estimates as indicated by the standard errors shown for the revised estimates. Thus, it is entirely possible the pay gap has indeed widened, it’s just been masked by sampling error. Such an argument is statistically plausible and happens to be one of many concepts I cover in my training course “Identify Trends & Make Forecasts” which I run on behalf of the Royal Statistical Society. Fortunately, ONS estimate 30 gender pay gaps and we can count how many of those show the pay gap narrowing and how many show it widening. This is the best way to see what the general trend is.
Using the table shown earlier, I count the following –
- Across all 30 pay gap estimates, 22 show the pay gap narrowing, 8 show it widening.
- Across the 15 median pay gaps, 12 have narrowed, 3 have widened.
- Across the 15 mean pay gaps, 10 have narrowed, 5 have widened.
- Across the 10 all employee pay gaps, 9 have narrowed, 1 has widened.
- Across the 10 full time pay gaps, 8 have narrowed, 2 have widened.
- Across the 10 part time pay gaps, 5 have narrowed, 5 have widened. It is worth noting 4 of the widening pay gaps are actually in favour of women, only 1 is widening against women.
In short, whichever way you cut it, the gender pay gap did not widen against women in 2026. The ONS’s 2026 gender pay gap report repeatedly notes the pay gap has narrowed at the national level. The Fawcett Society’s claim to the contrary in their 2026 “Equal Pay Day” campaign is incorrect and should be retracted.
— Would you like to comment on this article? —-
Please do leave your comments on either of these X/Twitter or LinkedIn threads.
— Subscribe to my newsletter to receive more articles like this one! —-
If you would like to receive notifications from me of news, articles and offers relating to diversity & pay gaps, please click here to go to my Newsletter Subscription page and tick the Diversity category and other categories that may be of interest to you. You will be able to unsubscribe at anytime.
— Want to know more about pay gaps? —
You will find a full list of my pay gap & diversity related articles here which are grouped by theme.
— Need help with understanding your pay gap? —
I offer the following services. Please click on the headings for more details.
- Analysis – I can dig deep into your data to identify the key drivers of your pay gaps. I can build a model using a large number of variables such as pay band, seniority, job function, location, etc and use this to identify the priority areas for closing your gaps.
- Training – I run training courses in basic statistics which are designed for non-statisticians such as people working in HR. The courses will show you how to perform the relevant calculations in Microsoft Excel, how to interpret what they mean for you and how to incorporate these in an action plan to close your gaps.
- Expert Witness – Has your gender pay gap data uncovered an issue resulting in legal action? Need an expert independent statistician who can testify whether the data supports or contradicts a claim of discrimination? I have experience of acting as an expert witness for either plaintiff or defendant and I know how to testify and explain complex data in simple language that can be easily understood by non-statisticians.
If you would like to have a no-obligation discussion about how I can help you, please do contact me.
