Here you can find my latest forecast of the 2017 UK General Election on 8th June. My forecast uses data from my latest UK Opinion Poll Tracker and it is worth reading that post in conjunction with this post.
My latest prediction using uniform regional swing adjusted for parties standing down is that the Conservatives will make a net gain of 52 seats resulting in a working majority of 119 seats. If anti-Conservative tactical voting takes place then this has the potential to reduce the Conservatives working majority to 73 seats which I am sure Theresa May would still be very happy with!
I have now developed 5 different models to examine the likely outcome in each seat though the first one is now redundant though this is still shown in seat-level forecasts:
- URS – Uniform Regional Swing, now superseded by URS+S.
- URS+S – Uniform Regional Swing + Standown Adjustment
- URS+T – Uniform Regional Swing + Tactical Voting
- EU16R – Brexit Realignment
- nURS – Non-Uniform Regional Swing
For more details on the methodology of all 4 models, please read my prediction for the seat of Bath where I explain how I make my predictions. The same process described for Bath is then repeated for all seats to arrive at my forecasts.
The predictions of each model are summarised in table P0. Please note that all models now incorporate an expected polling error of a 2.5% underestimate in the Conservative lead over Labour. This is based on my analysis of historical polling errors. Previously I assumed no polling error but I consider there to be sufficient evidence in the polling data to suggest that the Labour is likely to be overstated. This post by Matt Singh gives other reasons for expecting a polling error again.
My official forecast is given by my URS+S model whilst my URS+T model is an alternative forecast. These are highlighted in green in table P0.
Both my Brexit Realignment & non-URS models are intended as a sense check for the other two models at the moment and are coloured brown in table P0. I am not publicising these models as official forecasts yet but this could change in the future.
2. My Prediction using Uniform Regional Swing + Standown Adjustment
We now know how many candidates each party are putting up and the most noticeable change is that UKIP are only putting up 377 candidates compared to 600+ in 2015. The Greens have also stood down in many seats especially in Wales & Scotland. Consequently, I have added a Standown Adjustment process to my URS forecast to create a URS+S forecast instead which is what is shown in table P1A. You can read more details on this adjustment in my forecast of the North Norfolk seat.

Currently, my Party Stand Down Adjustment gives the Conservatives an additional net 3 seats than they would have had under a straight URS model. Their gains are North Norfolk, Eltham, Stoke North and Worsley & Eccles South. They would lose Brighton Kemptown.
Since my last update a week ago, Labour’s recovery in the polls has reduced the size of their losses in the North and Wales. Indeed on current figures, we could have a situation in the North where the Conservatives get more votes than Labour but fewer seats.
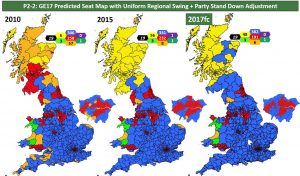
Chart P2-2 shows the expected map for 2017 which can now be compared with 2015 & 2010. The Conservative gains in Scotland, Cumbria and Lancashire are noticeable here. At present the Lib Dems would be wiped out of the South of England, a considerable change from 2010.
3. My Prediction using Uniform Regional Swing + Tactical Voting
There is currently a lot of noise on social media about the potential of tactical voting to hinder the Conservatives. My tactical vote model suggests that 6 existing Conservative seats would be lost and 17 of the projected gains under my URS+S model would not come to pass. This reduces their working majority to 111 seats as shown in table P1B.
One thing I would like to point out about my tactical voting model is that I have made a slight adjustment to the model which reduced the likelihood of tactical voting being successful. Previously I said that 75% of the available tactical votes would switch to the most favourable “progressive alliance” party. I have now reduced this to 67% because the recent polls almost certainly are picking up some intended tactical votes with Labour gaining at the expense of the Lib Dems and Greens. Therefore I run the risk of double counting tactical voting to some extent hence my adjustment.
Chart P2-3 shows the expected seat map if extensive tactical voting takes place. This time, the Lib Dems would gain seats in the South and London.

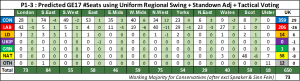
The 23 seats that could be lost due to tactical voting is larger than what I have estimated before. Part of the reason is that with parties standing down in many seats, ev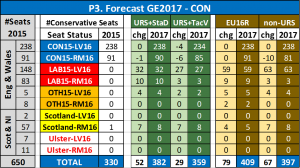 en though this gives the Conservatives more seats overall, it also increases the number of opportunities for tactical voting. Chart P3 gives an idea of where the different outcomes will occur. Interestingly, the expected gains from tactical voting are equally split between Remain and Leave seats.
The full list of the 23 seats where I think tactical voting will stop the Conservatives from winning is shown in table P4. The constituency name is coloured based on wh o held the seat in 2015 and whether the seat changed hands then. Along with how the seat voted in the referendum, I show my forecast for my 4 models. Obviously these are by definitions Conservative wins in the URS+S column and not Conservative in the URS+T column. The EU16R column for my Brexit Realignment is mostly Conservative but a few are Labour. The nURS column seems to be a synthesis of my URS+S & URS+T columns which is one reason why I am attracted to my nURS model.
The most notable feature of table P4 is the large number of seats in London. In fact, if this did happen on 8th June, the Conservatives would end the night with only 1 net gain in London. In the South West, Bath continues to be the bell weather seat for me for the success of tactical voting. Fail to take Bath and the Lib Dems
can kiss goodbye to any significant gains in 2017. I have already made this point before in a youtube clip which looked at the implications of the EU Referendum last year on the main parties.
4. My Predictions using Brexit Realignment Model
I have decided to add the detailed predictions of my Brexit Realignment model to this post even though this model is not intended to be an official forecast. However, there are some trends that I am perceiving that may make me change my mind on this. I intend to make a decision by next week so this post serves as a heads up.
In recent days, I have tweaked my EU16R model to allow for greater Lib Dem to Labour switching. This has the effect of wiping the Lib Dems out should this come to pass as can be seen in table P1-4.
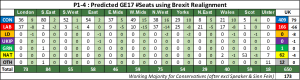
The other notable features of table P1-4 are how the Conservatives end up doing better in the North and Wales. This is because of the large number of Leave seats in these areas and the Conservatives stand best to exploit this. Chart P2-4 shows this effect more clearly.

5. My Predictions using non-Uniform Regional Swing
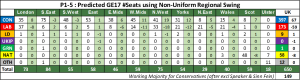
Again, I must caution that the predictions shown in this section are not official predictions. However, this model has a number of features that seems to incorporate elements of my other 3 models and therefore there is a good likelihood that next week I will decide to make this model my official forecast. For now, the predictions are those shown in table P1-5.
The EU referendum last year showed a new political divide especially between major city centres and small towns. I am of the belief that this dynamic could have an effect within each region and therefore assuming uniform swing within each region does not feel right. I devised an idea in the seat of Cardiff South & Penarth and further analysis with other seats such as Edinburgh South gives me confidence that the basic idea is sound. What I have to decide on are the exact values of the parameters in the model. Seat level polls would be the best way to derive the parameters but there has been a dearth of these in this election.
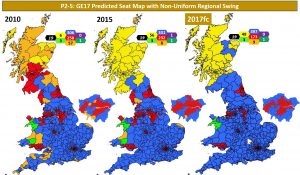
Chart P2-5 shows the expected seat map with non-Uniform Regional Swing. This model predicts the largest number of Labour gains (7 in all) which is not a surprise given the high Remain votes in these seats. Conversely, it predicts a larger number of Labour losses than under URS+S.
Factors not yet accounted for in my predictions
At present my election forecast does not take into the following points which could become factors in the final outcome.
- Differential turnout. The EU referendum saw significant increases in turnout in working class seats which had become apathetic about voting since 2001. The question is whether these voters will turn out again or whether turnout will fall because of voter fatigue. I am assuming the same turnout as the 2015 general election but I will be examining this assumption.
- Emerging demographic trends. I am assuming no significant changes in demographics that could influence the election. From what I can see, this assumption might be false as current polls are showing the Conservatives are just as popular among working class voters as they are among middle class voters. This is an astonishing turnaround but I think I can capture this through my Brexit Realignment model.
My Forecast Seat by Seat
Please click on the link below to download an Excel spreadsheet of my seat by seat forecast. At present, this spreadsheet only lists the expected winners for each of my 4 models and does not include expected vote share. This is something I will add at a later date and I will inform you accordingly in this post.
