The West England Combined Authority (WECA) Metro Mayor election of 2025 will probably be won with less than a quarter of all votes cast. My analysis shows it is a 5-way marginal, the likes of which have never been seen in England before. Why no-one has polled WECA is a mystery because this is shaping up to be one of the most unpredictable elections I’ve ever seen.
My forecast puts the Greens first with 24% but it also puts Reform, Lib Dems & Labour just behind with each on 20% and the Conservative and Independent candidates bringing up the rear. I am using a weighted average of four models of which 2 have Labour winning, 1 has the Greens winning and the 4th model (with the highest weight) has Reform winning. That’s how unpredictable the election is and why we need a WECA specific opinion poll!
This article is based on polls as of 7th April 2025. My updated forecast based on polls as of 26th April can be found here.
My election forecast track record
This will be my third forecast of a local election. My previous two efforts were –
- 2021 WECA Mayor – I used a likelihood approach to work out if the Conservatives were more likely than not to retain the mayoralty. I decided the answer was Yes but it turned out be No by some margin. Whilst pondering my 2025 forecast, I realised I had made an error in my 2021 analysis.
- 2024 Bristol City Council – I correctly predicted the Greens would win the election in terms of votes and seats but fall short of a majority. I didn’t write a blog for this forecast which was based on the concept of battlegrounds so the links here will take you to mixture of X/Twitter threads and articles in the local newspaper. Method here, Forecast here, Review here,
For a complete list of all my election forecasts and how accurate they were, please open my election forecast track record. The graphic below summarises my forecasting performance for UK general elections.

What is the West England Combined Authority?
WECA combines three unitary authorities, B&NES (Bath & North East Somerset), Bristol and S.Gloucs (South Gloucestershire). 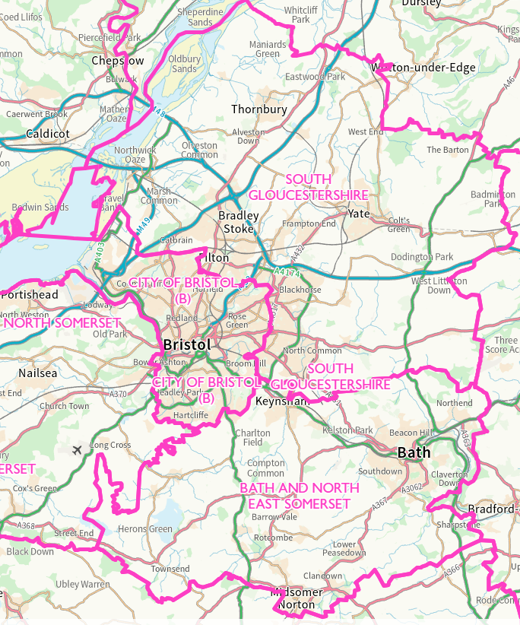 As the map shows, the Bristol conurbation is dominant but Bath is by no means overawed. When WECA was formed, the unitary authority of North Somerset was also invited to join but they declined. Prior to the 2021 election, North Somerset changed their mind and have been in discussions since. As yet, there is no proposal for this to happen but all the candidates for the WECA mayor support North Somerset joining WECA.
Between 2010 & 2023, the local authorities were perfectly aligned with 9 parliamentary constituency boundaries. This changed in 2024 and is no longer the case. WECA boundaries now span 9.4 constituencies. The 0.4 is the Frome & East Somerset constituency which intrudes into B&NES. I estimate 39% of voters in this seat live in B&NES and I have added that fraction to the other 9 seats when looking at WECA wide votes in the 2024 general election.
For more information about the history of WECA and the region, have a look at this informative Youtube clip.
How has WECA voted since 2010?
I am forever struck by WECA’s political diversity. Over the 9 elections shown in the table below, 5 different parties have come first; The Lib Dems in 2010, UKIP in 2014, Conservatives in 2015, 2017 & 2019, Labour in 2017, 2021 & 2024 and finally the Greens in 2019. Whilst there have only been two mayoral elections in that period in 2017 & 2021, I make a point of showing the other elections to emphasise the diversity of the area and this is going to be apparent in my 2025 forecast!
Data Sources – my prime source for general & EU elections is the House of Commons Research library sometimes supplemented with data from British Election Survey and the Electoral Commission. For local elections, I use Wikipedia which usually uses the local authority itself as the original data source. Note the table only shows votes for the first round of voting for the two mayoral elections. The top row of the table shows the election system (FPTP, SV, PR) in use for that election.
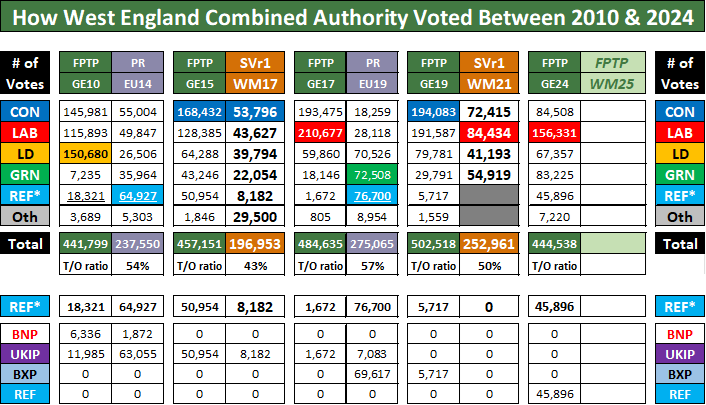
First, a word on Reform. The REF* row in the above table is actually the total of all votes given to four iterations of what are often called populist right parties. In 2024, it was just Reform but back in 2010, it was UKIP and the BNP. In 2015 and 2017, it was just UKIP but in the 2019 EU election it was UKIP and the Brexit Party. In the general election of 2019 it was just the Brexit Party and no populist right party stood in WECA in 2021. To make a local election forecast, I consider it justifiable to merge all such parties into the single REF* total. Where their numbers are underlined, it indicates more than one party make up the total.
A major change for the 2025 mayoral election is the election system itself. It will be First Past The Post (FPTP) as used in the 5 general elections shown. The two previous mayoral elections were under the Supplementary Vote (SV) system whilst the two EU elections used the d’Hondt variant of Proportional Representation (PR). Whilst the EU elections play no part in my forecast, I include them in the above table because they and the two SV elections were low turnout elections compared to the general election that preceded them. The turnout ratio values shown are the total number of votes in the EU or WECA election shown as a percentage of the total number of the votes in the preceding general election. For example, in the 2021 mayoral election, the total number of votes was 50% of the turnout in the 2019 general election. If the turnout ratio in 2025 is also 50% then we would expect a total of 222,000 votes cast.
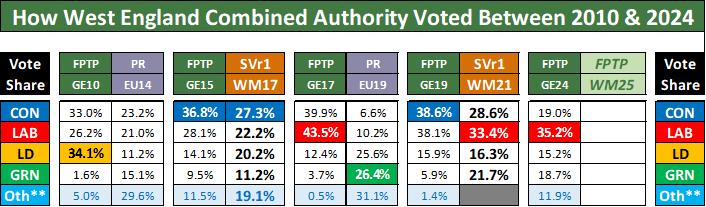
The table shows only 4 parties in the 2021 mayoral election. As discussed in the next section, there will be 6 candidates in 2025. In order to make a forecast, I have chosen to combined the REF* and OTH rows into a OTH** row as shown in the next table which shows share of total votes cast. This is the data I will use to make my 2025 forecast.
Who is standing in 2025?
There are 6 candidates standing in the 2025 election, up from 4 in 2021. The link takes you to the BBC website where there are further links to the personal statements of each candidate. The candidates represent the Conservative, Labour, Liberal Democrat, Green and Reform parties plus an Independent who is a former Labour councillor. Reform and Independents did not stand in 2021 but in 2017, there was a UKIP and an Independent candidate who was also ex-Labour.
For transparency, I am a registered voter living in B&NES. A personal bugbear I have with local elections in recent years is the increasing failure of parties to put their election literature through my letter box. I take the view that if you can’t be bothered to seek my vote, why should I bother to give you my vote? So far, I have seen the Conservative candidate on Facebook and the Reform candidate on X/Twitter but nothing otherwise from any other candidate. Yes I know what their manifestos are from the links in the BBC article but without this, I would be voting with no idea of what their platforms are. I don’t think this is healthy for democracy so my plea to the candidates is get out there and prove to me you want my vote!
Update 15th April 2025 – The BBC reports all voters in WECA will soon be receiving a booklet with manifestos from all of the candidates so that might explain the lack of campaigning so far. My first reaction is this doesn’t tackle my point. Whilst I can see the usefulness of this in raising awareness of local elections (often low turnout) among voters, it feels like the easy way out for the candidates. I will still be judging the candidates on whether it appears this is all they are prepared to do when it comes to campaigning or will they also be working their socks off to get my vote?
What do the latest polls say?
As far as I am aware, there has not been any polling specifically of WECA for this election. This means I will need to use national opinion polls at the Great Britain level to make my forecast. These do not have a great record in recent general elections so whether they work better for local elections is uncertain. In the table below, the figures for the 5 general elections are actual vote shares for Great Britain but for the other 4 elections and for 2025, they are averages of the 9 polls immediately preceding the election. Whilst I do show REF* and OTH separately in this table, it will be the OTH** row I will use in my forecast initially.
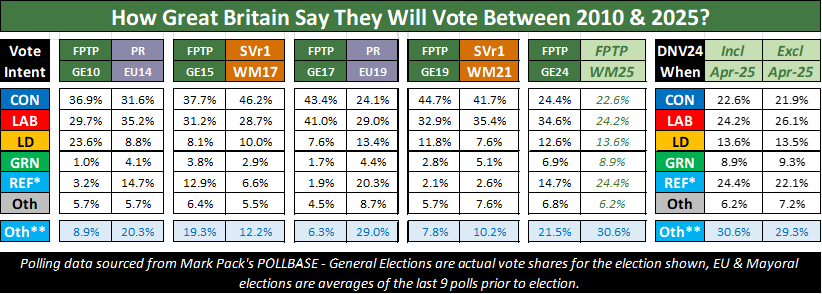
For 2025, I show two versions of the latest polls on the far right of the table. The INCL column is calculated in the same way as the figures shown for 2014 EU, 2017 mayoral, 2019 EU and 2021 mayoral elections. However, the 2024 general election saw a substantial drop in voter turnout from 67% to under 60%. The latest polls assume if a 2024 non-voter say they will vote in the next general election, they will do so. That might be true for a general election but I struggle to believe those non-voters from last year will vote in local elections this year.
Since the start of 2025, I have been collecting the crossbreaks from recent polls for those people who say they did vote in 2024. If polls are confined to this group only, you end up with the EXCL column. The main difference between the INCL & EXCL numbers are for Labour and Reform. Under EXCL, Labour stand 2 points better and Reform 2 points worse than INCL. This is because around 50% of non-voters say they will vote Reform whereas only 5% of such voters say they will vote Labour. Find Out Now is the only pollster who explicitly break out GE24 non-voters (which I denote as DNV24) as a separate crossbreak but my analysis of available crossbreaks from other pollsters show they must be seeing something similar in their numbers.
4 Models to turn polls into predictions
My four models for predicting the 2025 WECA mayoral election are –
- GE24-Diff-Excl : Change since 2024 general election using differential swing based on EXCL polling data.
- GE24-Ratio-Excl : Change since 2024 general election using ratio swing based on EXCL polling data.
- WM21-Diff-Incl : Change since 2021 mayoral election using differential swing based on INCL polling data.
- WM21-Ratio-Incl : Change since 2021 mayoral election using ratio swing based on INCL polling data.
As will become apparent, the order listed is also the weights I will use when I average across the four models to arrive at my forecast i.e. least weight to GE24-Diff-Excl, most weight to WM21-Ratio-Incl.
These models are permutations of two choices I need to make.
- Should I use the change in the polls since the last general election in 2024 (GE24) or since the last WECA mayoral election in 2021 (WM21)?
- Should I measure the change in the polls using Differential swing or Ratio swing?
- I explain the difference later on but election analysts I follow on social media agree ratio swing was the best option for predicting outcomes in the 2024 general election instead of the usual differential swing.
A related question to the first question is whether I should use latest polling data which Includes or Excludes 2024 non-voters as discussed in the last section? I’ve decided to exclude them when looking at changes since GE24. This is because I do not believe 2024 non-voters will turnout in 2025 in an election which normally sees half the turnout of general elections. However, if I look at changes since WM21, I will include those non-voters. This is because I do not have the data to exclude non-voters from the 2021 polls so in order to make a like for like comparison, I need to include the non-voters in my 2025 polling data.
What do the 4 models predict for 2025?
The predicted vote shares for each of my 4 models are shown in the table here. For now, 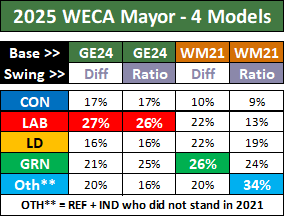 I predict the combined vote of the Reform and Independent candidates as OTH** because neither party stood in 2021. How did I arrive at these numbers?
Let’s start with the two differential swing models which are the simplest. For the GE24-Diff-Excl model, all I’ve done is add the change in vote share for each party as indicated by the national polls since the 2024 general election to that party’s vote share in WECA in 2024. For example, Labour‘s share of the vote in the 2024 general election in the WECA area was 35.2%. Since then, polls show the Labour vote nationally is down 8.5% if I exclude 2024 non-voters. Therefore the predicted Labour vote share in WECA for 2025 using the GE24-Diff-Excl model is 26.7% (= 35.2% – 8.5%).
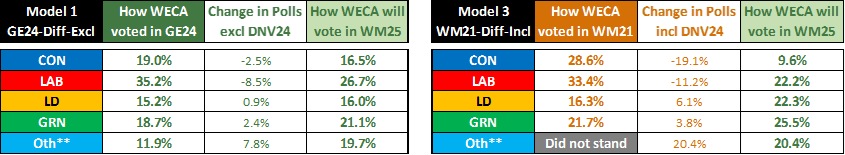
The same logic applies to WM21-Diff-Incl. For example, the Conservatives vote in the first round of the 2021 WECA mayoral election was 28.6%. Since then, the Conservative vote share nationally in the polls if I include 2024 non-voters is down 19.1%. This results in an estimated Conservative vote share of 9.6% (= 28.6% – 19.1%) in 2025.
The two ratio models work differently. Instead of adding or subtracting the change in vote share since the last election, I multiply by the ratio of the latest national polls to the vote shares in the last national election for each party. This will result in vote shares that do not add up to 100% across all the parties. Therefore, I need to normalise the vote shares so that they do add to 100%. The two ratio models are shown below.
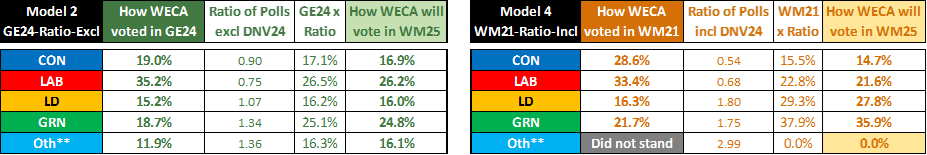
I will explain the GE24-Ratio-Excl model first starting with the Greens‘ vote share across WECA in the 2024 general election which was 18.7%. The latest national polls excluding 2024 non-voters show the Greens on 8.9% which is 1.34 times the Green’s national vote share of 6.9% in the 2024 general election. If I now multiply the Green’s WECA vote share in 2024 of 18.7% by 1.34, I end up with 25.1%. When I repeat this for all the parties though, the sum of the estimated vote shares will not be 100% but 101.2%. Therefore I need to divide 25.1% by 1.012 to end up with my final estimate for the Green‘s WECA vote share in 2025 of 24.8%.
The above table also shows the calculation for the WM21-Ratio-Incl model. However, there is a problem here. Since there were only 4 candidates in 2021, the OTH** row was 0% in 2021. Any multiplication of zero will always give zero for OTH** in 2025. Yet in the table I showed at the start of this section, I estimated OTH** at 34% so how did I get around this issue?
How did the 4 models perform in 2021?
I first asked myself whether it was necessary to resolve this issue. The question I asked was how did these models perform in the 2021 WECA mayoral election? If the WM17-Ratio-Incl (as it would have been back then) model had performed badly, I wouldn’t bother using it in 2025.
It turned out WM17-Ratio-Incl was the best predictor by far of the 2021 mayoral election. The table here shows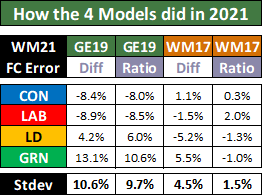 the forecasting errors for each of the 4 models where the forecasting error is the difference between the actual vote share and the predicted vote share. The standard deviation of these errors allow me to rank the accuracy of the 4 models and the last model wins out easily with a maximum error of 2 points for the eventual winner, the Labour candidate. I’ve detailed the full calculation below for the WM17-Ratio-Incl model.
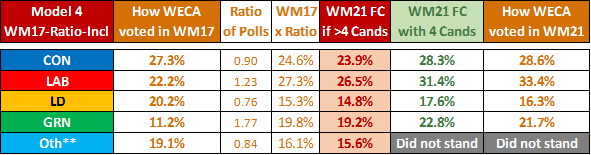
There is no multiplication of zero in this election because 2017 saw a UKIP and an ex-Labour Independent candidates making up the OTH** row. Together they got 19.1% of the vote in 2017 but by 2021, the combined national vote share of Reform (replacing UKIP) and Other parties was 0.84 (=10.2%/12.2%) times the national vote share of UKIP plus Others in 2017. That initially results in 16.1% for OTH** but this is then normalised to 15.6% by dividing by 1.031 since the middle column sums to 103.1%. This results in what the forecast would have been had at least one other candidate stood in 2021 as shown by the lightly red shaded column.
To get to a four candidate forecast, I need to reallocate the estimated 15.6% vote share for OTH** to the other four parties. The simplest way was to reallocate in proportion to their estimated vote shares when more than four candidates stand. I can do this by dividing the four parties’ red shaded vote shares by 0.844 since the sum of their red shaded vote shares is 84.4%. This is what gives the final forecast for the 2021 WECA mayoral election.
The low errors are frankly remarkable. This is why I said at the start that I now realise I made an error in my 2021 WECA mayor forecast. I never considered ratio swing back then and missed the opportunity to call the election properly. What’s even more remarkable is that the remaining errors which are very small can be explained. Both the Conservatives and Labour in 2021 are slightly underestimated and the Liberal Democrats and Greens are slightly overestimated. Recall the final forecast proportionately reallocated the 15.6% OTH** vote share to these four parties. But OTH** in 2017 were those voting for UKIP and an ex-Labour Independent. It does not then surprise me that these voters would be more likely to redistribute themselves to the Labour and Conservative candidates and less likely to the Green and Lib Dem candidates.
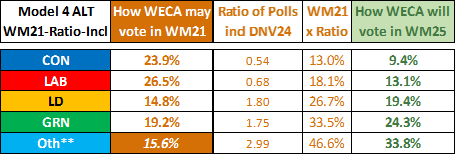
In order to get a forecast for OTH** in 2025, what I did was to redo the ratio swing but replace the 2021 WECA vote shares with the lightly red shaded vote shares estimated in the table above. This is my estimate of what the vote shares would have been in 2021 had more than four candidates stood in 2021. This results in the calculation shown in the table below.
Who will win the 2025 Mayoral Election?
The last step I need to undertake before arriving at my forecast is to decide how I will split my estimated OTH** between the Reform and Independent (ex-Labour) candidates. This is a similar setup to the 2017 mayoral election when the Independent candidate took almost 80% of the OTH** votes. This time Reform are notably stronger in the polls than UKIP ever were in 2017 and they have chosen a candidate Aaron Banks who I think has greater name recognition than the independent candidate. I decided to assume 80% of OTH** votes will go to Reform in 2025.
This results in my forecast as shown in the table. Due to the clear difference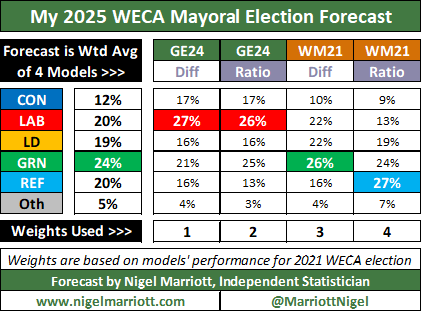 in performance of these models in the last mayoral election in 2021, I decided to make my final forecast a weighted average of the four models. The 4 model forecasts are shown from left to right in ascending order of weights with the WM21-Ratio-Incl model getting 4 times the weight of the GE24-Diff-Excl model.
On average, the Greens come first with 24% but Labour, Lib Dems and Reform are all on or around 20% which is nothing in the grand scheme of things. What I will say is the Green and Lib Dem estimates are fairly stable across the 4 models unlike the Labour, Conservative and Reform parties which vary a lot between the models. The Conservatives are behind in all models but I am happy to call this a 5-way marginal with the Greens most likely to win and Conservatives least likely.
What could go wrong with such a forecast?!
Where my forecast could go wrong
A lot. I’m going to go through party by party and list all the ways they could be under or over estimated.
Let’s start with the Conservatives. I think my forecast of 12% on average is much more likely to be an underestimate than an overestimate. One of the assumptions I’ve made with the two GE24 models is that 2024 non-voters will not vote in 2025. I think this is a good assumption to make but if it is wrong, it will be Conservative non-voters who are most likely to vote in 2025. I say this because the collapse in the Conservative vote in the general election was known to be driven in part by Conservative voters staying at home. Their motivation may have been driven by apathy in respect of the party in Westminster but that doesn’t automatically mean it will extend to all local elections. A good local candidate might still be able to get their (absent last year) vote out.
Moving onto the Lib Dems, polls published in the last few days look like they are showing a bounce for the Lib Dems. At the moment, they are not included in my latest polls for 2025. When I update my forecast towards the end of April, this bounce if sustained will feed through and give the Lib Dems a boost.
What about Labour? They are in the same boat as the Conservatives in terms of model uncertainty but start as the incumbent. I’ve not looked at the latest polls in depth but where they show a Lib Dem bounce, this is at the expense of Labour. The second factor is that the current WECA mayor Dan Norris has recently been arrested and charged with rape and sexual assault. He was never seeking re-election in the first place but could there still be a local reaction against Labour that harms their current candidate? I think my forecast for Labour is more likely to be an overestimate than an underestimate.
Reform is the hardest party to forecast. They didn’t stand in 2021 and so have no obvious base to build on. On the other hand, they are polling comfortably at 25% in the national polls and the local elections across England is a real opportunity to show they are now a political force. They’ve chosen a candidate with name recognition (as far I am concerned) and depending how he campaigns, he must have a chance in a 5-way marginal. Whilst one of my models have them winning, it has to be remembered my model did not predict Reform directly. Instead, it predicted a combined Reform + Independent and then split that total 80:20. That split is a pure finger in the air assumption and if the Independent candidate does better than I expect, Reform won’t be winning.
Lastly, we come to the Greens who are the favourite according to my models at the moment. Until now, they have always been in opposition. But last year, they took minority control of Bristol City Council. That means Bristol voters have had a year of experiencing life under Green rule. Has that made them more or less favourable? I have no intelligence on the ground personally but I think as a general rule in these times, incumbent ruling parties find it hard to sustain support. Therefore there is a risk my models are overestimating the Greens.
My Plea to Pollsters
Please poll WECA! I truly think we have a near 5-way marginal the likes of which have never been in English elections before. Why wouldn’t you want to poll it?
Other forecasts of the 2025 WECA mayoral election
In the absence of any polls at present, here is a list of other forecasts I have seen in the media and on social media for this election. I will update this list if I see new forecasts elsewhere.
- GRN 25%, LAB 24%, LD 22%, CON 14%, REF 13%, IND 3% on 12th April by Elections Predictor & Political Commentary on X/Twitter.
- GRN 27%, LAB 23%, REF 18%, CON 17%, LD 13%, IND 2% for 9th-23rd April by YouGov, the first published poll for WECA.
- LAB 23%, CON 21%, REF 18%, GRN 18%, LD 15%, IND 5% for 16th-21st April by MoreInCommon, the second published poll for WECA.
- Democracy Briefing Podcast – Overview of the WECA Mayor Election – This is not a forecast as such but it does review the political history of WECA and concludes the election is likely to be a 5-way marginal.
- A BBC report on the WECA election – no forecast given but it gives some backdrop to the election. Note the first half covers another election, WECA is reported in the second half of the article.
- An ITV report on the WECA election – again no forecast given but you do get to hear from each of the candidates.
**Updated forecast as of 26th April 2025**
I have published my updated forecast here.
— Would you like to comment on this article? —-
Please do leave your comments on this X/Twitter thread.
— Subscribe to my newsletter to receive more articles like this one! —-
If you would like to receive notifications from me of news, articles and offers relating to Elections & Polling, please click here to go to my Newsletter Subscription page and tick the Elections and/or Surveys category and other categories that may be of interest to you. You will be able to unsubscribe at anytime.
— Read some of my other blog posts on elections —
More posts can be found by clicking on the Elections tab at the top of your screen.
