The West England Combined Authority (WECA) Metro Mayor election of 2025 will probably be won with less than a quarter of all votes cast. My analysis shows it is a 5-way marginal, the likes of which have never been seen before in England. All five parties have reasons to be optimistic but as of now, I and most other forecasters make the Greens favourites to win the 2025 WECA mayoralty. With an election this tight, the parties get-out-the-vote efforts will play a big part in the final outcome.

All forecasts, charts & tables are based on the latest polls as of 26th April 2025.
My Forecast for the 2025 WECA Mayoral Election – Part 1
This article is an update to my first forecast published on 14th April 2025. Please do read that if you haven’t done so since it covers the following points and what I write in part 2 is a continuation of what I wrote in part 1 –
- My election forecasting track record
- What is the West England Combined Authority?
- How has WECA voted since 2010?
- Who is standing in 2025?
- What do the latest polls say?
- 4 Models to turn polls into predictions
- What do the 4 models predict for 2025?
- How did the 4 models perform in 2021?
- Who will win the 2025 Mayoral Election?
- Where my forecast could go wrong
- My plea to pollsters
- Other forecasts of the 2025 WECA mayoral election
My Forecast for the 2025 WECA Mayoral Election – Part 2
I am calling this election a 5-way marginal with the Greens most likely to win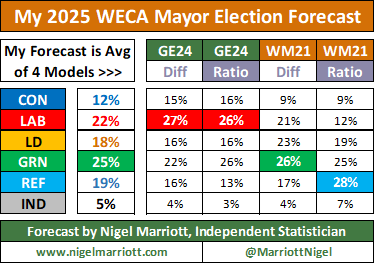 . This was my conclusion two weeks ago and I have not changed my mind. There are minor changes though to the predicted vote shares of each party due to three changes I’ve made to my forecasting methodology.
The first is I am now taking a simple average of my 4 models instead of a weighted average as before. I explain why I made this change in the next section but it is due to two WECA Mayor polls being published by YouGov & MoreInCommon plus a forecast made by an independent election forecaster Elections Predictor & Political Commentary. Links to these predictions are given in the next section.
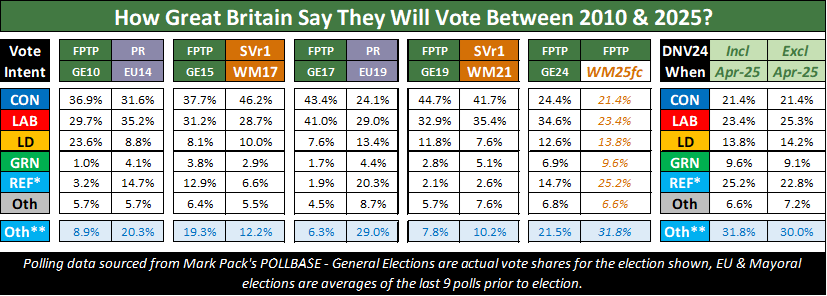
The second reason is more polls have been published in the last two weeks and the estimated national shares of each party have changed slightly. The averages of the last 9 national polls are shown on the right of the table below in two columns Incl & Excl. The difference comes from Including or Excluding the voting intentions of those who did not vote in the 2024 general election. I use Incl for my two models based on changes in the polls since the last mayoral election in 2021 and Excl for my two models based on changes in the polls since the last general election in 2024. More details of this distinction can be found in my forecast from two weeks ago.
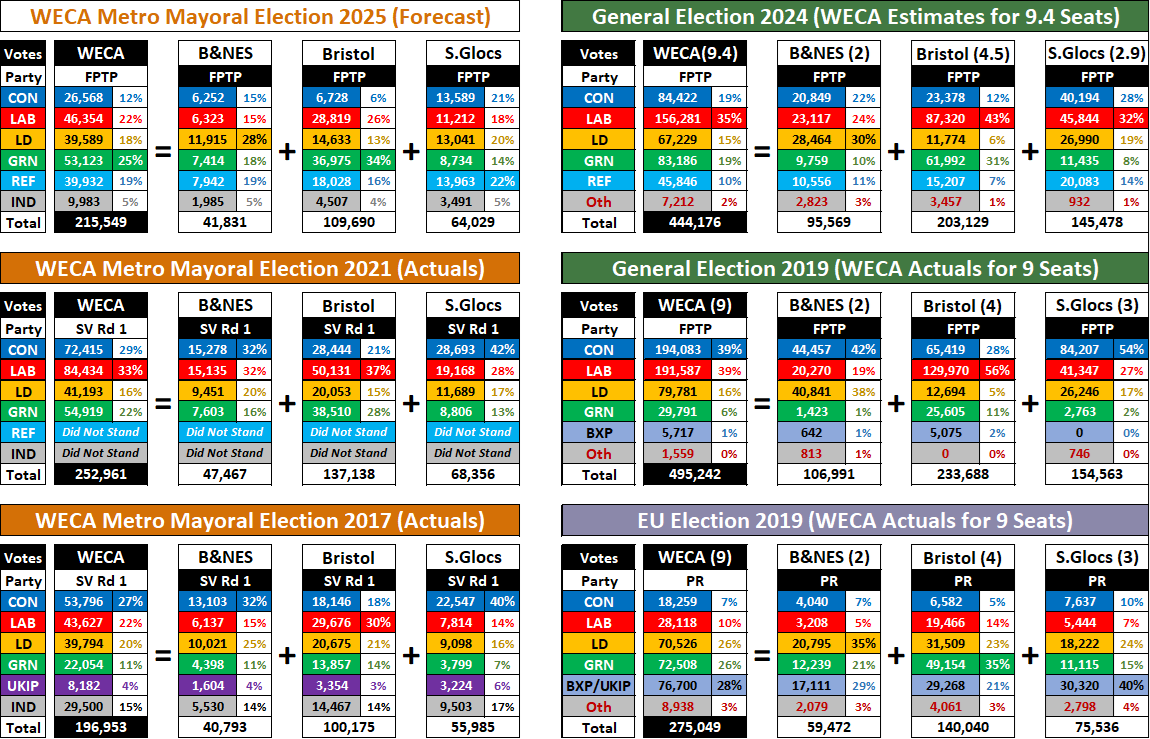
The third reason is I am now making separate estimates for each of the three unitary authorities of WECA, namely Bath & North East Somerset (B&NES), City of Bristol (Bristol) and South Gloucestershire (S.Glocs). I then combine the separate estimates to arrive at my final WECA forecast. This change was the result of feedback to my earlier forecast where it was pointed out to me that turnout in the 2021 mayoral election in Bristol was probably inflated due to local council elections being held at the same time. Since this is not happening in 2025, it is reasonable to expect Bristol turnout to be lower this time relative to B&NES and S.Glocs turnout. The only way to incorporate this effect is to apply my 4 models to each authority separately so as to produce three separate forecasts before combining. This is what I have done in the table below.
On the left of the table, the total number of votes cast in WECA is broken down by the three unitaries for my 2025 forecast and the previous two mayoral elections in 2021 and 2017. On the right, I’ve repeated this breakdown for the last two general elections in 2024 and 2019 and the EU election in 2019. In 2019, the boundaries of the three unitaries mapped perfectly to the boundaries of 9 parliamentary constituencies. However, the 2024 general election used new seat boundaries which no longer map perfectly to the three unitaries. This is why the title of the 2024 table states WECA now covers 9.4 (strictly 9.38) seats. The brackets after each unitary name shows my estimate of how many seats map to that unitary.
It is worth taking time to examine this table. In fact, I have made it available as a Microsoft Excel spreadsheet WECA Mayoral Election 2025 Forecast Builder so you can see the effect of changing various numbers on my forecast. To do this, edit the number of votes (not the vote shares) for each party within each local authority. All other figures such as share of vote, WECA total and grand totals will then change automatically.
Here is what I see in the table.
- In the 2017 mayoral and 2019 EU elections (both low turnout elections), the total number of votes in Bristol was slightly higher than those of B&NES & S.Glocs combined. I am assuming a similar outcome for 2025 unlike the notably inflated turnout observed in Bristol in 2021.
- In both general elections, the combined turnout of B&NES and S.Glocs is notably higher than Bristol’s. That points to the Bristol electorate being more politically engaged when it comes to the lower turnout elections. This could be a dynamic to watch for this week. If Bristol repeats what happened in 2021, Labour & the Greens will do better than expected.
- The 2019 EU election plays no part in my 2025 forecast. I include it because it took place at a time when national polls were not far off where we see them today (look back at the polling table to see this) and it was a low turnout election. Back then, the Lib Dems came first in B&NES, the Greens were first in Bristol and the Brexit Party (now Reform) came first in S.Glocs.
- Now look at my 2025 mayoral forecast. It predicts the Lib Dems will come first in B&NES, the Greens first in Bristol and Reform first (just) in S.Glocs. Obviously Brexit was the key issue in 2019 but the political mood today is arguably just as fragmented as it was then. This is one reason why I am comfortable with my forecast.
Why I now use a simple average of my 4 models
The reason I decided to use a weighted average of my 4 models two weeks ago was because I tested each model by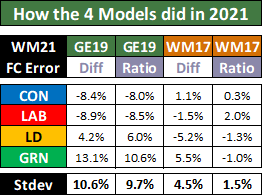 getting them to predict the outcome of the 2021 mayoral election. The result was this table which showed my two models based on changes in polls since the prior mayoral election in 2017 did much better than my two models based on changes since the prior general election in 2019. The best predictor was my 4th model WM17-Ratio-Incl.
Since then, two voting intention polls for WECA specifically have been published plus a prediction made by an independent election forecaster –
- GRN 27%, LAB 23%, REF 18%, CON 17%, LD 13%, IND 2% – a WECA mayoral voting intention poll undertaken between 9th & 23rd April 2025 by YouGov.
- LAB 23%, CON 21%, REF 18%, GRN 18%, LD 15%, IND 5% – a WECA mayoral voting intention poll undertaken between 16th & 21st April 2025 by MoreInCommon.
- GRN 25%, LAB 24%, LD 22%, CON 14%, REF 13%, IND 3% – a WECA mayoral forecast posted by Elections Predictor & Political Commentary on X/Twitter on 12th April using a model based on trends in national polls combined with census 2021 demographics.
- REF 25%, GRN 24%, LAB 19%, CON 17%, LD 11%, IND 4% – **added on 2/5/25 after this article was published and is not included in the discussion below**, a WECA mayoral voting intention poll undertaken between 28th & 29th April by FindOutNow.
Just observing the headline numbers for those links confirms what I said about my forecast. The 2025 WECA mayoral election is a true 5-way marginal the likes of which I have not seen in an English election before. Whilst I am endeavouring to bring my forecasting skill (or lack of) to this task, what I see here tells me in the end, the outcome will come down to whichever party is able to get out their vote. WECA residents should expect to bombarded by the candidates this week!
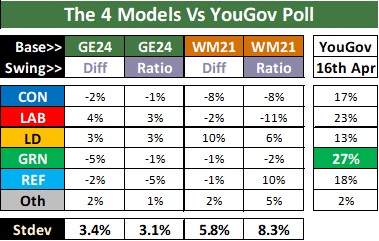 However, I was curious to see which of my 4 models came closest to these three additional forecasts. I started with YouGov’s WECA voting intention poll and ended up with this table. which shows a clear story. WM21-Ratio-Incl is now the worst predictor of the poll and the best predictor is GE24-Ratio-Excl. Both models predicting changes since the 2024 general election perform better than the two models predicting changes since the 2021 mayoral election.
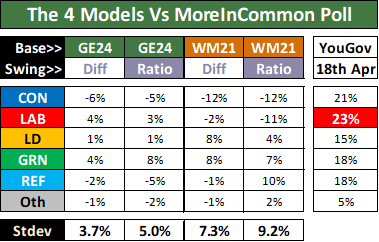 Then I compared my models with MoreInCommon‘s WECA poll to get this table. Again, the two models predicting changes since the 2021 mayoral election perform worse than the two models predicting changes since the 2024 general election. The best predictor of MoreInCommon‘s poll is the GE24-Diff-Excl model.
Finally, I compared my models 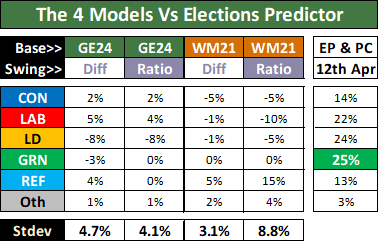 with the prediction made by Elections Predictor. This forecaster uses national polling trends like me but also uses demographic data from the 2021 census. For example, it’s known that education level and age are good predictors of voting intention. This time, the best predictor is WM21-Diff-Excl though it’s worth noting its sibling WM21-Ratio-Incl is the worst predictor.
I am not making this up! Each of my 4 models is the best predictor of some scenario. For this reason, I abandoned my weighted average from two weeks ago and went with a straight average of my 4 models for my final forecast.
Four WECA mayoral election forecasts – what is the narrative?
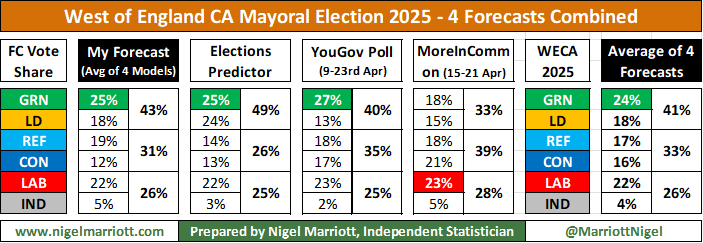
Let’s place my forecast alongside the two voting intention polls and the other forecast. On the right of the table below, I have also calculated the average across the four forecasts. At first sight, it looks there are four different narratives but I think they can be reconciled.
First, let me remind you of what I said earlier. This is a true 5-way marginal which is incredibly difficult to forecast. The parties get-out-the-vote efforts will have a big say on the final outcome and could be decisive.
The one thing I and my fellow forecasters appear to agree on is what’s Labour vote share will be, 22% or 23%. Labour are the governing party nationally and the incumbent WECA mayoralty holder but they are historically unpopular today. Since the Independent candidate is an ex-Labour councillor, I think it makes sense to say just over a quarter of voters will vote for these two candidates combined.
The difficulty is estimating how those opposing or unhappy with Labour will vote. I have grouped the other four candidates by whether they are on the left (Greens and Lib Dems) or on the right (Conservatives and Reform). Here I note YouGov and I are broadly in agreement in terms of the left and right split with around a third of voters going to the right and the rest to the left. More in Common is more bullish for the right whilst Elections Predictor is more bearish.
It is the allocation within the left and right opposing parties which presents the greatest difficulty. Within the right, I am most bullish on Reform, MoreInCommon is most bullish for the Conservatives whilst YouGov & Elections Predictor cannot split them. Within the left, all of us have the Greens ahead of the Lib Dems but the gap varies from 14 points for YouGov to just 1 point for Elections Predictor. The gap on the left between the Greens and Lib Dems will be heavily driven by turnout differentials between Bristol and B&NES & S.Glocs combined. Over 70% of the WECA Green vote comes from Bristol so if Bristol turnout is notably lower than expected then the Lib Dems will do better than expected.
In the end, three of us have the Greens winning the mayoralty with MoreInCommon predicting a Labour victory. In the table above, I average the four forecasts to get the numbers on the right where it might look like the Greens and Labour are ahead of the other three parties. But as I’ve already pointed out, differential turnout between Bristol and elsewhere in WECA will play an important part in the final outcome. I still maintain this is a genuine 5-way marginal where all five parties can have reasons to be optimistic even if the Greens are favourites.
— Would you like to comment on this article? —-
Please do leave your comments on this X/Twitter thread.
You can find the X/Twitter thread for my earlier forecast here.
— Subscribe to my newsletter to receive more articles like this one! —-
If you would like to receive notifications from me of news, articles and offers relating to Elections & Polling, please click here to go to my Newsletter Subscription page and tick the Elections and/or Surveys category and other categories that may be of interest to you. You will be able to unsubscribe at anytime.
— Read some of my other blog posts on elections —
More posts can be found by clicking on the Elections tab at the top of your screen.
