I am breaking a golden rule of pay gap reporting in this article, I am benchmarking the 33 London Borough Councils on their gender pay gap data!
Before you gasp in horror, let me say straightaway the outcome of this article is complete vindication of this golden rule. Benchmarking of employer pay gap data is statistically worthless. Pay gap data of all kinds is inherently multivariate and cannot be reduced to one number league tables. The story I will tell of the 33 councils of London in 2024 proves this point in spades. In short, none of the councils have a gender pay gap in effect despite all of them publishing data to the contrary.
Where to find gender pay gap data for 33 London Councils?
- Download my gender pay gap data spreadsheet and look up each council’s name. This is the best choice for long term trends.
- Visit the Government Equalities Office (GEO) Gender Pay Gap Data site and search for each council’s name.
- Download this Microsoft Excel spreadsheet which has the data I will use in this article.
- Visit this Ordnance Survey site to see a map of London with the boundaries of each London Borough Council.
- The map below comes from this site and I have added a geographical key which starts in the centre and then spirals out anticlockwise to the suburbs starting in the west and ending in the north.

33 London Councils in March 2024
In the table below, I’ve sorted the 33 London councils in descending order by how much their median woman is paid per hour assuming their median man is paid £1 per hour. I’ve split them into three groups of 11 based on this statistic. The top 11 councils are in purple, the middle 11 are in white and the bottom 11 are in green. The median council (the 17th of the 33 in the list) is highlighted in black. The first column is the geographical key shown in the map above and is coloured according to an area of London.
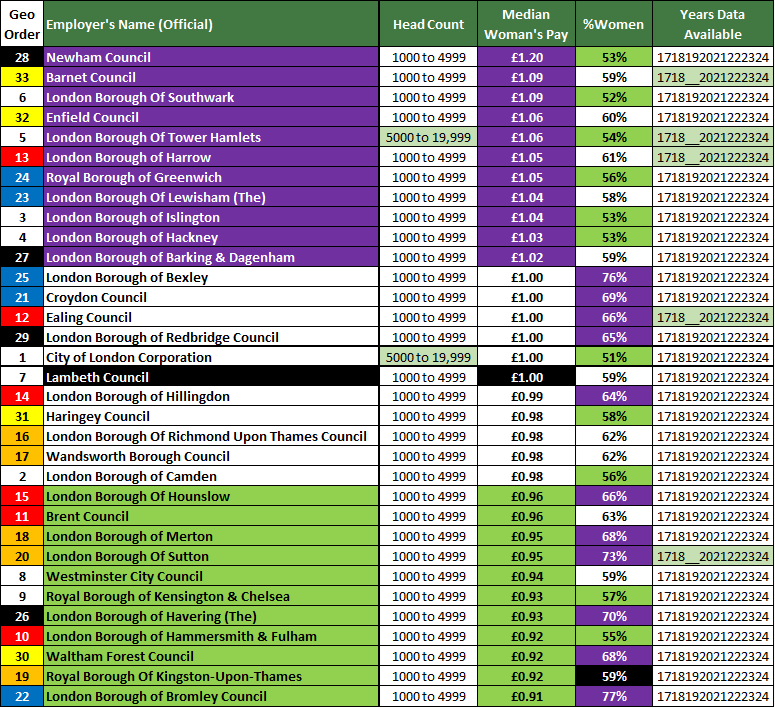
Those who do not understand pay gaps will give plaudits to Newham Council since they are top of the list and give brickbats to Bromley since they are bottom of the list. Newham’s median pay gap is 20% in favour of women which is officially recorded as –20% under the GPGR (Gender Pay Gap Reporting) regulations. They appear to be somewhat anomalous since the next council on the list Barnet has a pay gap of -9%. At the bottom of the list, Bromley has a pay gap of 9% in favour of men which is denoted as +9% under GPGR.
Why is this league table statistically worthless? If your definition of gender equality requires pay gaps to be eliminated, then pay gaps favouring women should be treated no differently from pay gaps favouring men. On that basis, Newham with a -20% pay gap is the worst council by far, followed by Barnet & Bromley with pay gaps of -9% and +9% respectively. The best councils would be those whose median pay gaps are exactly 0% and there are 3 such councils which are Ealing, Redbridge & City of London. They sit above the 17th council (and thus the median council of the 33 London councils) which is Lambeth whose pay gap rounds to 0% but officially it’s +0.1%.
Those who do understand pay gaps will have already been looking at the column to the right of the median woman’s pay column which shows what percentage of FPRE (Full Pay Relevant Employees as per GPGR regulations) are women. This column immediately tells you anyone who seeks to benchmark the 33 London councils on the gender pay gap alone is an idiot.
Can we compare 33 London Councils?
Before I explain the idiocy of benchmarking pay gaps, I want to talk about employer comparisons in general.
There are five reasons why it might be legitimate to compare the 33 councils of London –
- They all come under the political scope of the Greater London Authority whose mayor is currently Sadiq Khan.
- They share similar pay scales for the people they employ.
- They have to deliver the same services to their residents.
- They are of similar order of magnitude in terms of number of employees, varying between 1,000 & 6,000 employees.
- They are likely to be recruiting from the same pool of candidates especially since the quality of public transport in London means employees can live in one borough and work in another.
So comparing Ealing with Greenwich say is more likely to be a valid apples v apples comparison rather an invalid apples v potatoes comparison. It is certainly a far more justified comparison than say comparing British Airways with Ryanair. Both are airlines but that is more or less where the comparison ends. British Airways is a British global full service airline whereas Ryanair is an Irish low cost European short haul airline with a very different operating model.
There are two reasons why benchmarking pay gaps is for idiots. The first is pay gaps are multivariate, not univariate, as I will be demonstrating in the next three sections. The second is a pay gap benchmarking exercise gives you no insight as to what an employer should be doing to reach what they define to be equality in the first place. Different employers in the same sector can quite legitimately have different definitions of gender equality as I first explained in my article “Does the NHS hinder gender equality?” If so, you’re not going to learn much from a comparator whose definition differs from yours.
Having said that, the 33 London councils are probably an exception to the second reason in that it is entirely possible for all 33 to have the same definition of gender equality. If true, benchmarking pay gaps will still not work due to the first reason, namely the multivariate nature of pay gap data.
From Univariate to Bivariate
So what did those who do understand pay gaps spot in the earlier table? The percentage of FPRE who are women shown in the column to the right of the median woman’s pay has also been colour coded in the same way as for median woman’s pay. I show the same table below, this time sorted by the %Women column. The 11 most female heavy councils are coloured purple, the 11 most male heavy employers are coloured green and the remaining 11 are white with the median employer in black who happens to be Kingston-upon-Thames.
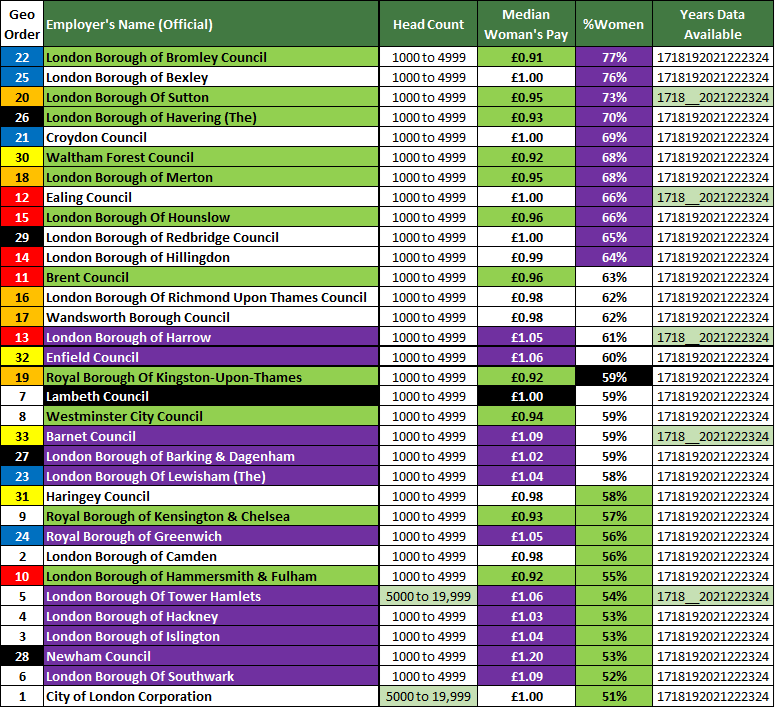
By using the same colour coding logic for both columns, the Bivariate (two variables) nature of the data is illustrated. If there was no relationship between the two columns then on average for each Tertile (i.e. the top, middle & bottom third of the councils) based on the %FPRE who are women, we would expect equal numbers of purple, white (or black) and green councils based on their median woman’s pay. 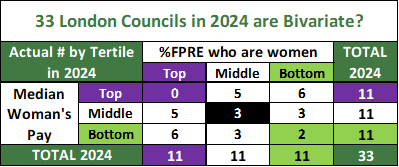 With 11 councils in each tertile, we would expect 3.67 councils in each of the nine combinations of tertiles. In practice, the distribution of councils differs notably as shown in the tables here.
For example, among the top 11 councils based on their median woman’s pay, none are in the top tertile for %FPRE who are women. Among the bottom 11 councils based on their median woman’s pay, 6 are in the top tertile for %FPRE who are women. The 2024 table is indicating an inverse correlation whereby the more women you have as a percentage of your FPRE, the lower your median woman’s pay is relative to your median man. Conversely, the fewer women you have, the more your median woman is paid relative to your median men. Such a correlation is called bivariate behaviour.
If you insist on univariately ranking the 33 councils of London by their median pay gap and giving plaudits to Newham and brickbats to Bromley, what you are also doing according to this table is praising Newham for having fewer women and berating Bromley for having too many women.
From Bivariate to Multivariate (median pay gap)
Employer pay gap data is in fact Multivariate (multiple variables) rather than bivariate. The following set of scatter plots demonstrate this for the 33 London councils. In all three plots, the vertical axis shows the median woman’s pay per hour for every £1 paid to the median man in 2024. The plots differ by the variable displayed on the horizontal axis. From right to left they are –
- %Upper Pay Half FPRE who are women (average of the %women figures for the upper and upper middle pay quarters)
- %Lower Pay Half FPRE who are women (average of the %women figures for the lower and lower middle pay quarters)
- The Difference between the Lower Pay Half & the Upper Pay Half
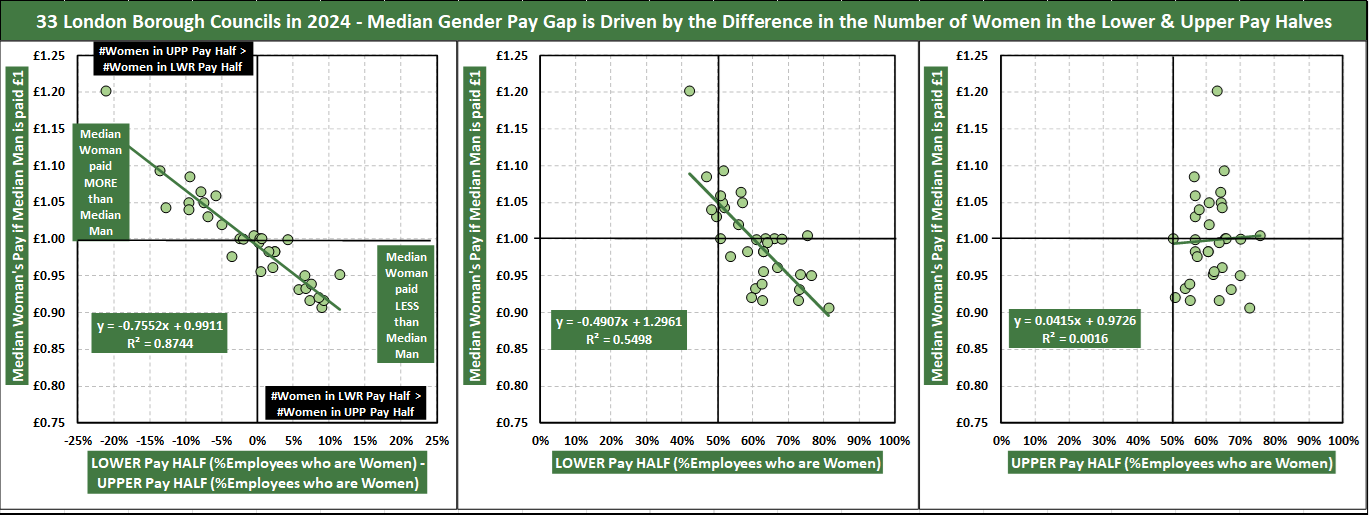
The laws of maths tells us if the gender ratio in the upper pay half and the lower pay half are the same, the median gender pay gap must be zero. This is a point I’ve made many times before and is the principle underpinning my concept of gender swap numbers. For some examples of this principle in action, take a look at my articles on Ryanair, DWP and a selection of 8 employers. The chart on the left, which I will explain in a minute, confirms this principle since the intercept of the fitted line is more or less £1.
When the gender ratios differ between the two pay halves, do both halves influence the median pay gap equally or does one half have a greater influence than the other on the median woman’s pay? For the 33 London councils, the answer is clear. The proportion of women in the upper pay half (right hand scatter plot), which varies between 50% at City of London Corporation & 76% at Bexley, shows no correlation with median woman’s pay. On the other hand, there is a clear correlation between the proportion of women in the lower pay half (middle scatter plot), which varies between 42% at Newham and 82% at Bromley, and median women’s pay. Newham and Bromley are of course the two councils noted earlier at the top and bottom of the table when the 33 councils are sorted by their median woman’s hourly pay relative to men.
An even stronger correlation is to be found in the left hand chart. 87% (the R-Squared coefficient) of the variation between the 33 London councils in terms of their median gender pay gap can be explained by the difference in the gender ratios between the lower & upper pay halves. This difference is in fact the first step in my gender swap number calculation. More than that, the chart is saying the gender ratios of both the lower & upper pay halves together explain most of the median pay gap but when looked at separately, the lower pay half matters more than the upper pay half.
The bottom line from these charts is that in order to decipher the story of each council, one cannot look at the median pay gap on its own. One must look at the interplay between three variables (median pay gap, gender ratio in upper pay half, gender ratio in lower pay half). In other words, the behaviour of any London council’s pay gap data is multivariate.
**If you want to learn more about the various methods of Multivariate Analysis in general, take a look at the training options I offer here**
From Bivariate to Multivariate (mean pay gap)
The multivariate behaviour of London councils’ pay gap data is even stronger in these three charts. This time, the vertical axis shows the mean (average) woman’s pay per hour for every £1 paid to the mean (average) man in 2024. Along the horizontal axis from right to left, the variables displayed are –
- %Upper Pay Quarter FPRE who are women
- %Lower Pay Quarter FPRE who are women
- The Difference between the Lower Pay Quarter & the Upper Pay Quarter
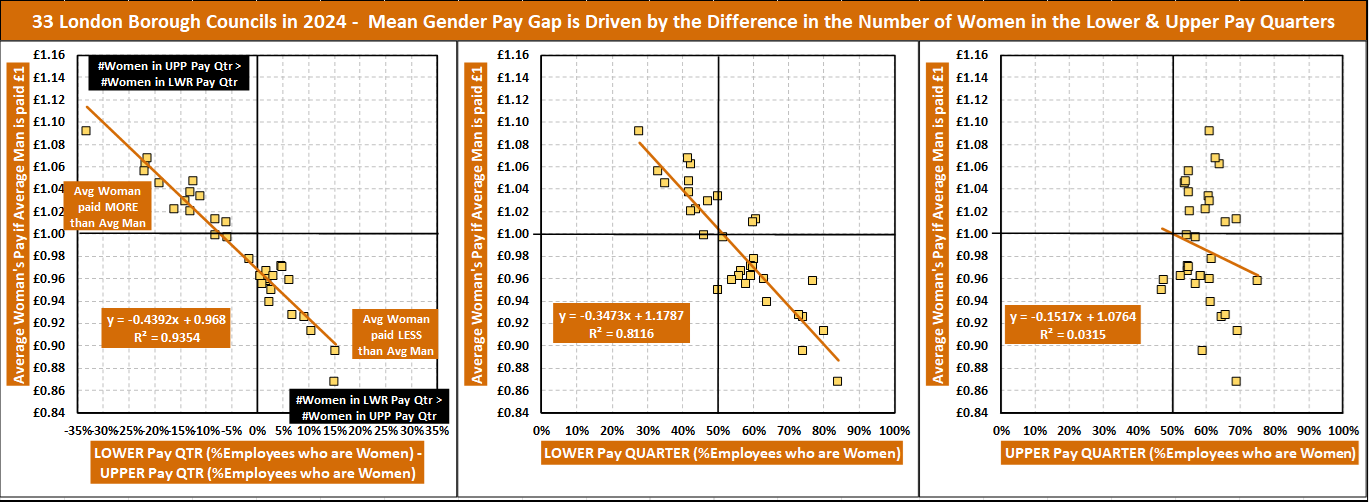
The reason why the median is usually preferred to the mean when looking at pay is the mean (or average) can be significantly influenced by extreme values at each end of the pay range. By extension, the mean pay gap should be more influenced by the gender ratios in the upper and lower pay quarters as opposed to the pay halves hence why the charts above focus on these two pay quarters instead.
The same question arises, which pay quarter better explains the variation in the average hourly pay of women relative to men? Again, the answer is clear for London councils. Only 3% is explained by the upper pay quarter gender ratio, 81% is explained by the lower pay quarter gender ratio and 94% is explained by the difference in gender ratios between the lower & upper pay quarters. I conclude the mean pay gap is explained by the gender ratios of both pay quarters but the lower pay quarter is more influential than the upper pay quarter. This is another demonstration of the multivariate behaviour in the pay gap data of London councils.
The golden rule – only idiots benchmark employers’ pay gap data univariately
Here are the 33 London councils sorted & colour coded by the median woman’s pay per hour as before. This time, the table also shows the other variables I’ve used in the last three sections, each colour coded according to their tertiles with green for the lower 11 councils, white for the middle 11 and purple for the upper 11. The colours alone demonstrates the multivariate nature of the 33 London council’s gender pay gap data.

The most striking feature of this table is how the 11 councils in the top (purple) tertile based on their median woman’s pay are also the same councils making up the top (purple) tertile for average woman’s pay and the lower (green) tertiles for the gender ratio differences between the lower and upper pay halves and lower and upper pay quarters. At the other end of the table, 6 councils are green for mean and median woman’s pay and purple for the differences in %women between the lower & upper pay halves and lower and upper pay quarters.
Only idiots would use this table to award points, plaudits and benchmarks to individual councils. Some of those may understand and agree with this sentence but then think it is still OK to rank and judge the 33 London councils separately on each of the 5 variables shown. If you do this, what you are in fact doing is five separate univariate benchmarking exercises making you an idiot five times over.
The only way to read this table is to compare councils on a single 5-dimensional variable i.e. a multivariate variable. If a gun was put to my head and I was forced to benchmark the 33 London councils, I would only do that using the 2nd Principal Component (see last section for more details) which would be one of the 5-dimensional multivariate variables available to me. It is unlikely I would rotate the components and I would probably assess the councils on the magnitude of this component.
Those who understand pay gaps will have already grasped this point even if you have never heard of PCA (Principal Components Analysis) and are not clear what I’m talking about. From a comparison of the 33 London councils in 2024 across 5 variables, such people will draw the striking conclusion that none of the councils had a gender pay gap. The councils of London are in fact 33 facets of a 1 body.
Comparing is not the same as Benchmarking
The last paragraph might confuse some people since up to now, I appear to be using the words benchmarking and comparing interchangeably. In fact, my choice of words have been deliberate since they mean different things to me –
- Benchmarking uses lists of employers to score, judge and/or set targets for employers.
- Comparisons uses lists of employers to learn more about the differences between employers which may or may not reveal actionable insights for your employer.
In the case of the 33 London councils, my comparison (not benchmarking!) has uncovered a remarkable insight.
33 London Councils – We are One
There is only one local authority in London. Why do I say this?
The clue is to look at the variation between the 33 London councils in terms of their %FPRE who are women. As observed earlier this varies from 50% for the City of London to 77% for Bromley. Given the councils have to provide similar services, many of which involved highly gendered roles, and have similar pay scales, is variation on this scale plausible given the average council in London is 61% women and has ~3,000 employees?
The answer is no which I base largely on the even wider variation observed in the lower pay quarter where the %FPRE who are women varies between 28% and 84%. as well an application of the Central Limit Theorem. Variation on this scale has to be due to strategic choices made each council in how they deliver their services rather than radically different recruitment & pay policies. This is reinforced by the multivariate nature of the council’s pay gap whereby any variation in this proportion is strongly correlated with an equivalent variation in the pay gap statistics.
So what are the strategic choices councils could make which could result in multivariate pay gaps? Having read many of the gender pay reports published by the various councils (links can be found in the spreadsheet I made available at the start), they appear to be shared services between councils and/or outsourcing/insourcing specific services. I demonstrate with an example in the next section on Newham Council.
The corollary of what I have just said is that if all 33 London councils made the same strategic choices, the variation in the pay gaps and gender ratios between councils would be significantly reduced. At that point, any observable differences between the 33 London Councils would be no different to the variation which would be expected from chance alone as I explained in my 2018 article “Life on Mars“ which was my first ever pay gap case study. That would mean the 33 London councils could be regarded as clones of each other or in other words the 33 London councils are in fact one.
Newham shows 33 goes into 1
The story of Newham is told in the table here 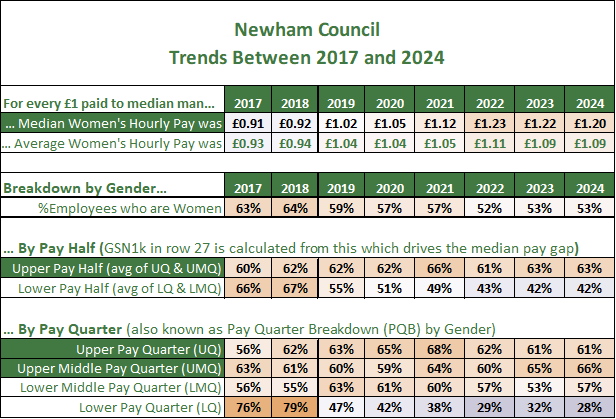 which shows their gender pay gap data between 2017 & 2024. In 2017, Newham paid their median woman 91p for every £1 paid to their median man. By 2024, the median woman was being paid £1.20 instead, a dramatic change which Newham’s clueless CEO could not resist celebrating with shouts of joy from the rooftops here in 2023. As I explained earlier, Newham in fact have the worst pay gap of all 33 London councils and you can also see and hear me dissect his idiotic statement 16 minutes into this Youtube clip.
How did this change come about? The table gives the answer. In the top three pay quarters, the %FPRE who are women has been mostly stable since 2017. The average across the upper, upper middle & lower middle pay quarters over the 8 years is 61% with most of the 24 data points fluctuating between 55% & 65%. These fluctuations are for the most part consistent with what could be expected from an employer with ~4000 staff covering a range of roles (some gendered) which fluctuate in numbers of people employed and where the employer is making no effort to change any gender stereotypes of roles.
When it comes to the lower pay quarter, an extraordinary change has taken place. In 2017, 76% of these roles were undertaken by women but by 2024, this had totally flipped with 72% of these roles now undertaken by men. It’s no wonder why the gender pay gap flipped from favouring men to favouring women but how did this come about?
The answers can be found in two reports published by Newham council which are their 2022 gender pay gap report (I can’t find a later one) and a workforce equality report for the years 2017 to 2021 (again can’t find a later version). These show Newham employed 5,009 staff in 2017 before falling substantially in 2018 & 2019 to 3,297 employees before slowly rising to 4,064 employees by 2022. The main reason for the change was outsourcing over 900 catering & cleaning assistants in 2018 and bringing in house over 300 refuse collectors & drivers in 2022.
You can’t get more gendered low paid roles than these in local authorities! First, Newham get rid of their low paid women and then replace some of them with low paid men. This is the “true gender equality” the CEO of Newham Colin Ansell was celebrating in his idiotic 2023 press release.

Were Newham gaming the system by using my Be Lean! method I describe in “10 quick & easy ways to close your gender pay gap!“? The answer is no because far from closing their pay gap, they actually ended up widening their gap from 9% (against women) to 20% (in favour of women).
Instead, Newham were taking strategic decisions on the best way to deliver services to their residents in the most cost effective way, a task any local authority should be doing. This task must take precedence over any goals they set themselves in terms of diversity and inclusion. However, Newham should have foreseen what the effect of their strategic choices would be and laid them out in their gender pay gap reports and other diversity reports.
This goes for all 33 London councils. The multivariate relationships I’ve described in this article show a strong link between pay gaps and the proportion of women in their workforces. Newham is an example showing that strategic decisions taken by councils are the main driver of multivariate pay gaps, not the specific actions each council are taking in terms of gender equality. After all, the median council for median pay gaps is Lambeth with a pay gap which rounds to zero and the average of the mean pay gap is 1.4% which is almost zero. In other words, the 33 London councils collectively have no gender pay gap and any difference between them is the result of strategic decisions on insourcing/outsourcing of services and sharing of services between councils. Hence, London can say “We Are One!“.
**APPENDIX** – Is PCA (Principal Components Analysis) the next step for you?
If pay gap data is inherently multivariate, what methods should be used to analyse such data? You can find a list of the main multivariate statistical methods here but one of the most common methods used is Principal Components Analysis or PCA. Depending on your statistical software, you will sometimes find PCA listed under Factor Analysis which is a closely related method.
The scatter plots I showed you earlier to demonstrate the multivariate nature of pay gap data are in fact the starting point of PCA (to be exceptionally precise, principal components modelling rather than analysis). Were I to complete a full PCA, I would arrive at these plots which are from left to right a Scree plot, a Correlation Bi-Plot and a PCA Map of the 33 London councils.

I show these charts to whet your appetite. If you would like to know if PCA is for you, here’s how you can find out more –
- Follow this link and read the material in section A which shows PCA being used to understand the weather in the UK.
- Take my training course in Multivariate Analysis which can be based on your own data.
- Arrange a 1-on-1 coaching session to be structured to your specific requirements.
- Engage me as a consultant to turn your pay gap data into insights and actions.
— Would you like to comment on this article? —-
Please do leave your comments on either of these LinkedIn or X/Twitter threads.
— Why I write these case studies —
My case studies explore good and bad practice with gender pay gap analysis and highlights what can be learned from them. Closing a national pay gap can only happen if change happens within individual employers in the first place. In the front line of such change will be the HR department who in my experience find basic statistics a struggle and so I hope they find these case studies illuminating.
- “Life on Mars“, – I work out how much variation in gender pay gaps can be expected by chance. I then show that the variation in pay gaps across the 4 UK subsidiaries of my former employer Mars UK was within the bounds of chance and that in effect they had no gender pay gap. Based on my experience of working there, I explored some of the reasons why Mars did not have a pay gap.
- “The good, the bad and the Unilever“. I looked at the two legal entities of Unilever who are required to report their gender pay gap and noticed that the year on year changes between 2017 & 2018 looked odd. I used them as an inspiration to explain how one can spot if year on year changes are plausible or not.
- The effect of Samira Ahmed winning her equal pay claim against the BBC and what impact it would have on their gender pay gap. Confusion abounds over the difference between unequal pay and gender pay gaps and I showed that the impact of Samira winning the case could be to widen the pay gap instead.
- “What is the gender pay gap at Novartis UK“. Novartis perfectly illustrate the hazard of Simpson’s paradox when analysing pay gaps where employees simultaneously work for an employer with a gender pay gap favouring women and a gender pay gap favouring men.
- “Why Ryanair’s gender pay gap report is my favourite“. I explore the 6 purposes of an employer’s pay gap report and show how Ryanair mostly fulfill these in less than half a page despite having the largest verified gender pay gap of all employers and a dodgy bar chart!
- “How the Conservatives eliminated their gender & ethnicity pay gaps“. I look at how the Conservatives went from having no ethnicity minority MPs and almost no female MPs to having the UK’s first non-white minority Prime Minister and why I consider them an important public case study for employers who wish to do the same.
- “Why the Dept of Work & Pensions still has a Gender Pay Gap” – Officially, the DWP pay gap is zero. This is because of an unusual pay policy that results in the median man being paid the same as the median woman. The reality is there is still work to do close their gaps.
— Subscribe to my newsletter to receive more articles like this one! —-
If you would like to receive notifications from me of news, articles and offers relating to diversity & pay gaps, please click here to go to my Newsletter Subscription page and tick the Diversity category and other categories that may be of interest to you. You will be able to unsubscribe at anytime.
— Want to know more about pay gaps? —
You will find a full list of my pay gap & diversity related articles here which are grouped by theme.
— Need help with your pay gap? —
I offer the following services. Please click on the headings for more details.
- Analysis – I can dig deep into your data to identify the key drivers of your pay gaps. I can build a model using a large number of variables such as pay band, seniority, job function, location, etc and use this to identify the priority areas for closing your gaps.
- Training – I run training courses in basic statistics which are designed for non-statisticians such as people working in HR. The courses will show you how to perform the relevant calculations in Microsoft Excel, how to interpret what they mean for you and how to incorporate these in an action plan to close your gaps.
- Expert Witness – Has your gender pay gap data uncovered an issue resulting in legal action? Need an expert independent statistician who can testify whether the data supports or contradicts a claim of discrimination? I have experience of acting as an expert witness for either plaintiff or defendant and I know how to testify and explain complex data in simple language that can be easily understood by non-statisticians.
If you would like to have a no-obligation discussion about how I can help you, please do contact me.p
