The year 2025 was both the hottest and 2nd hottest year on record in the UK. Last year, I used a CUSUM Chart to conclude “if the calendar year average is greater than 9.48 degrees Celsius and the meteorological year average is greater than 9.33 degrees Celsius … (this will) signal an upwards trend change“. By co-incidence, the average 24-hour temperature across the UK in 2025 was 10.09 degrees Celsius for both the calendar (Jan to Dec) and the meteorological (Dec to Nov) years which is clearly higher than these thresholds. It’s only taken me four years of writing to conclude a new upward trend in UK temperatures has begun.
Learn how to decide if a trend has changed
This is the fourth article I have written about trends in UK annual temperatures. My goal is to create a useful series for anyone who wants to learn how to use statistical thinking and methods to detect changes in trends for any time series. If this topic is new to you, I recommend you read the series from the beginning before continuing with this article.
- 2022 – I explain what a Control Chart is which is a technique arising out of the field of Statistical Process Control. I calculate the Control Limits for the control chart using the years 1997 to 2021 and I explain why I use just those years based on an 11 year Centred Moving Average (CMA). When I plot 2022 data on the control chart, I decide there is not enough evidence to conclude the trend has changed.
- 2023 – I update my control chart with 2023 data but I do not change the control limits used in the chart which continue to be based on the years 1997 to 2021. I now conclude “a step change upwards has taken place but the pace of change is not yet clear.”
- 2024 – I update my control chart with 2024 data which continues to use control limits based on the years 1997 to 2021. I build another control chart using meteorological year (December to November) data instead to see if my conclusions change as a result of changing the definition of a year. I find that it does and I decide to withdraw my conclusion of 2023. I then introduce another method of detecting trend changes known as CUSUM.
- 2025 (this article) – I update my control charts for calendar & meteorological years with 2025 data which continue to use control limits based on the years 1997 to 2021. I also update my CUSUM charts and draw conclusions about future trends.
Detecting changes in trends is one of the topics I cover in my training course “Identifying Trends & Making Forecasts“. I also run this course on behalf of the Royal Statistical Society and you can book a place on their next course here.
In this article, I draw conclusions after reviewing three types of charts (Trends, Control, CUSUM) for two alternate definitions of a year (Calendar, Meteorological). I first go through the three charts for calendar years which cover January to December and then go through the three charts for meteorological years which cover December to November. Unlike previous years, I will no longer explain the methodology in depth behind each chart and will instead link to one of the earlier articles which provides the necessary depth. All temperature data shown in this article can be downloaded from the Met Office.
C1 – UK Annual Average 24-Hour Temperature – Calendar Year
In 2025, the average 24-hour temperature across the whole of the United Kingdom from 1st January to 31st December was 10.09 degrees Celsius. This is the highest on record beating the previous high recorded in 2022 (10.03 degrees).
In the chart below, I plot the UK annual average temperature for the calendar years going back to 1884 as purple dots. The solid black line is the 11 year Centred Moving Average (CMA) which is intended to represent the underlying trend. The latest CMA is for 2020 covering the years 2015 to 2025 and was 9.60 degrees Celsius, the highest on record.
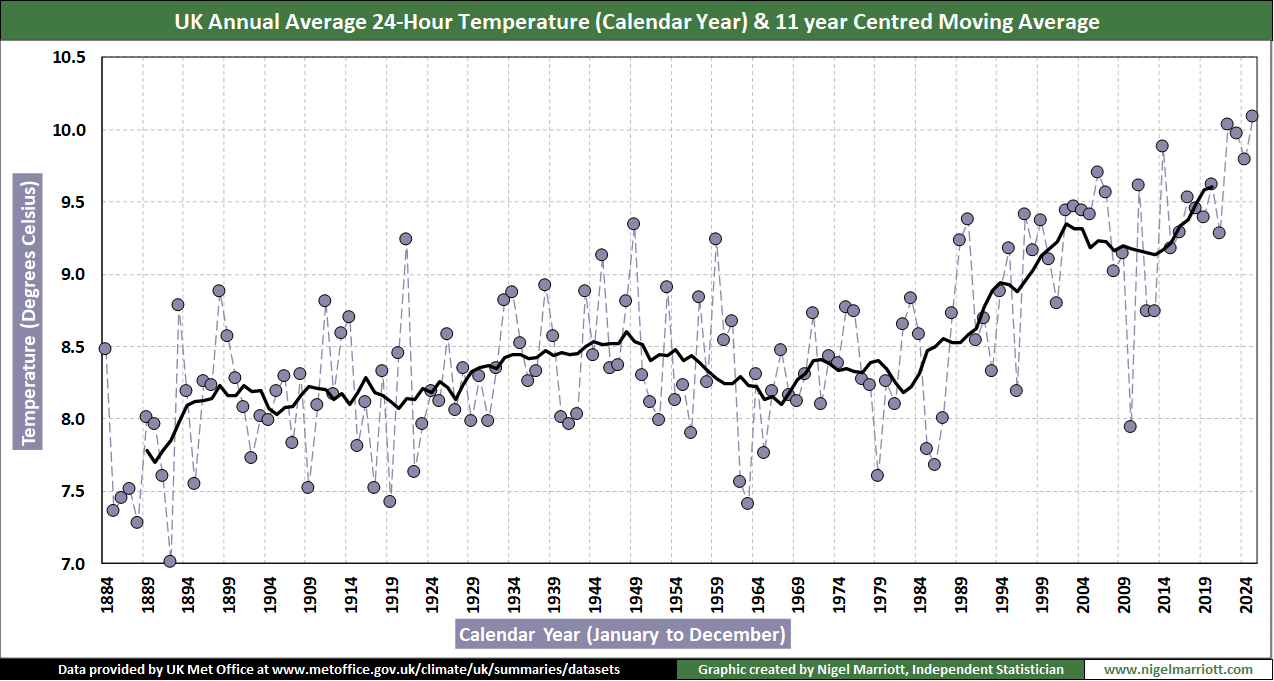
The 11 year CMA shows the following –
- Warming at the end of the 19th century.
- Static temperatures up to the end of the 1920s.
- A slight warming in the 30s and 40s.
- A cooling back 1920s levels in the 50s & 60s.
- Erratic temperatures in the 70s & early 80s.
- A sustained rapid warming beginning in the mid 80s that carried on through the 90s.
- Essentially flat for the first 15 years of the 21st century.
- An upward trend over the last 10 years, a trend I am trying to verify in this article.
C2 – Control Chart for UK 24-Hour Temperature – Calendar Year
The control chart for the period 1997 to 2025 is shown below. The years 2022 to 2025 are shown as large squares instead of circles to indicate those years were not used to calculate the control limits (the five brown lines). From top to bottom, the values of these, based on standard SPC rules which I first described in 2022, are as follows –
- UCL3 = Upper Action Limit = 10.46
- UCL2 = Upper Warning Limit = 10.07
- Target = Long Term Average = 9.27
- LCL2 = Lower Warning Limit = 8.47
- LCL3 = Lower Action Limit = 8.07

Standard SPC rules consider the following outcomes for any year as a significant indicator that something has changed –
- If a year lies outside either the lower (LCL3) or upper (UCL3) action limits. Such changes can be one off Blips as happened in 2010.
- If 2 successive years lie above the upper warning limit (UCL2).
- If 2 successive years lie below the lower warning limit (LCL2). Mirror image of above.
- If 8 successive years lie above the target value (Target).
- If 8 successive years lie below the target value (Target). Mirror image of above.
SPC rules are not cast in stone and there are many variants. However, they do offer a fairly robust method of detecting changes which are widely used in many industries.
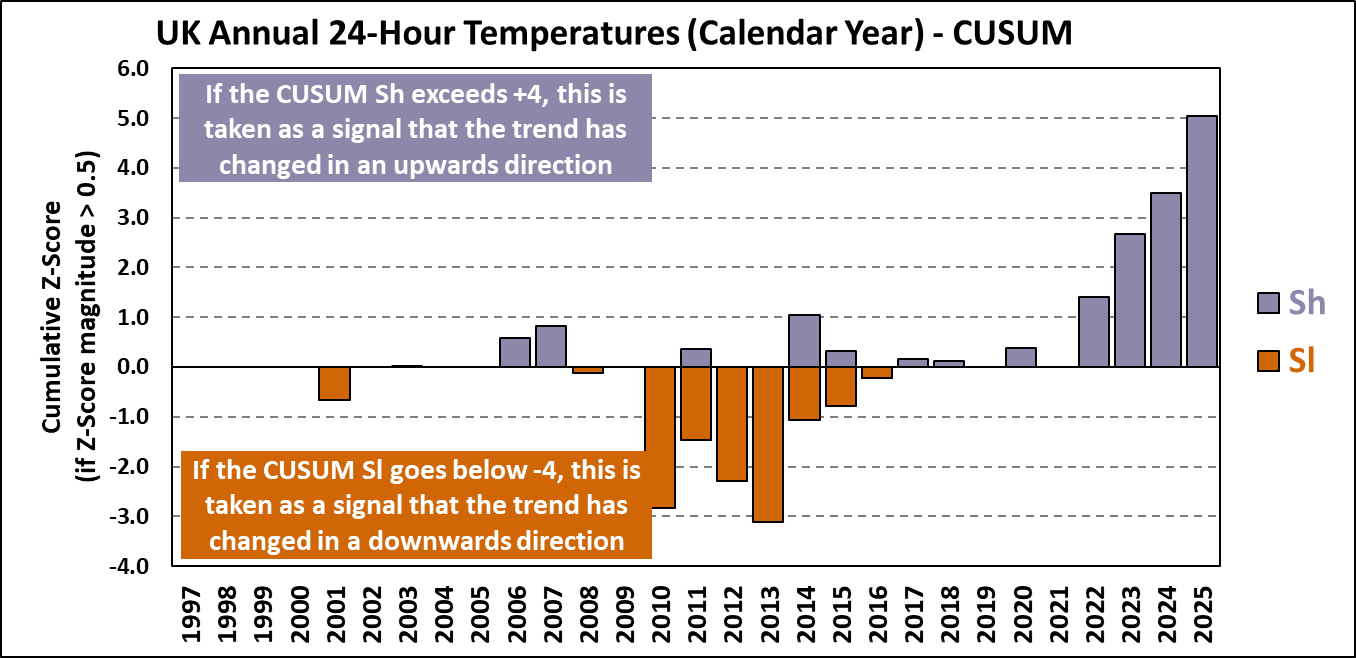
C3 – CUSUM Chart for UK 24-Hour Temperature Trends – Calendar Year
The CUSUM approach is not one I use much in my professional life but I am using it here because it is considered part of the SPC toolbox. For a detailed description of how the CUSUM statistics are calculated, please read the last part of my 2024 article.
The chart below (based on calendar year data) plots two separate Cumulative Sums, Sh to detect upward trends and Sl to detect downward trends. If Sh exceeds +4, that is usually taken as a signal that the trend has turned upwards, if Sl is below -4, that is usually taken as a signal that a downward trend has begun. Some people prefer to use thresholds of +5 and -5 but I will use +4/-4 for now.
As of 2025, Sl is 0 and Sh is +5.0.
M1 – UK Annual Average 24-Hour Temperature – Meteorological Year
The reason I like to look at trends by meteorological year in addition to calendar year is as protection against distorted trends. By doing what appears to be a minor change (shifting the start of the year back one month), if my interpretation of the trend differs between the two definitions, it is a warning to me that what I think am I seeing is more likely to be a mirage than a true signal. This is what I concluded last year when I presented meteorological year data for the first time.
In 2025, the average 24-hour temperature across the whole of the United Kingdom from 1st December 2023 to 3oth November 2024 was 10.09 degrees Celsius. This is the 2nd highest on record, exceeded only by 2022 (10.20 degrees).
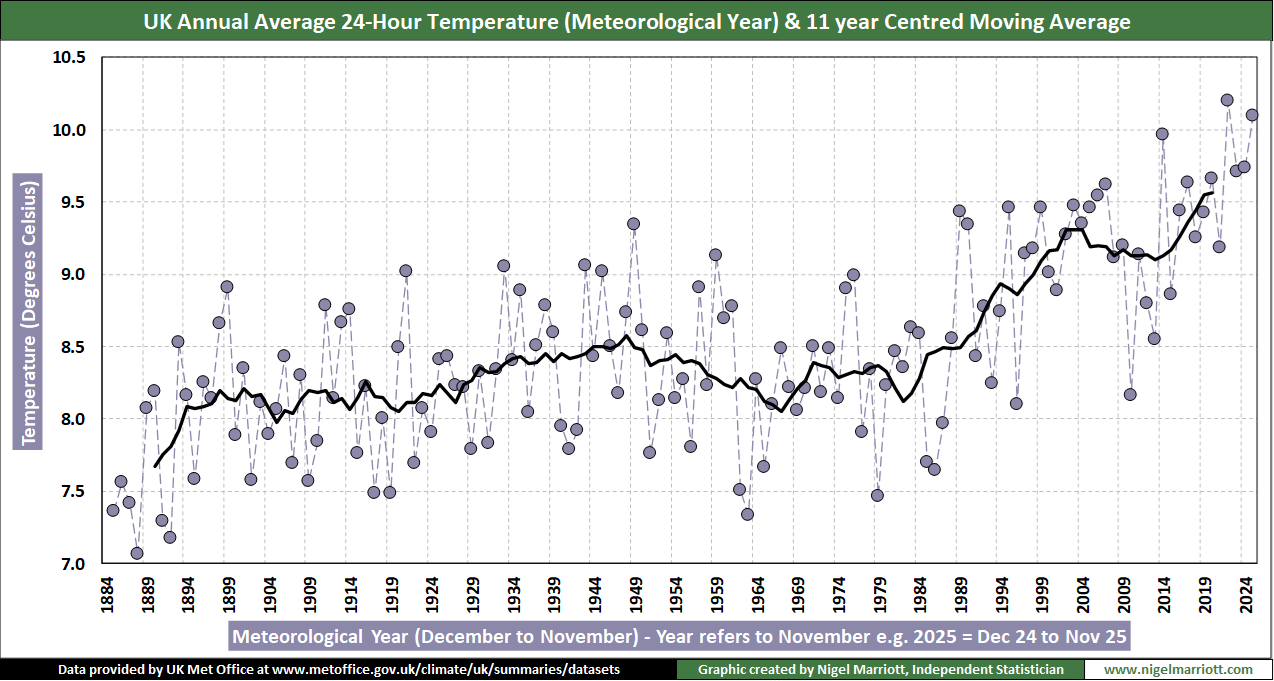
The overall history in this chart is no different from what is shown in the same chart for calendar years. The 11 year CMA as of 2020 is 9.56 degrees Celsius, the highest on record.
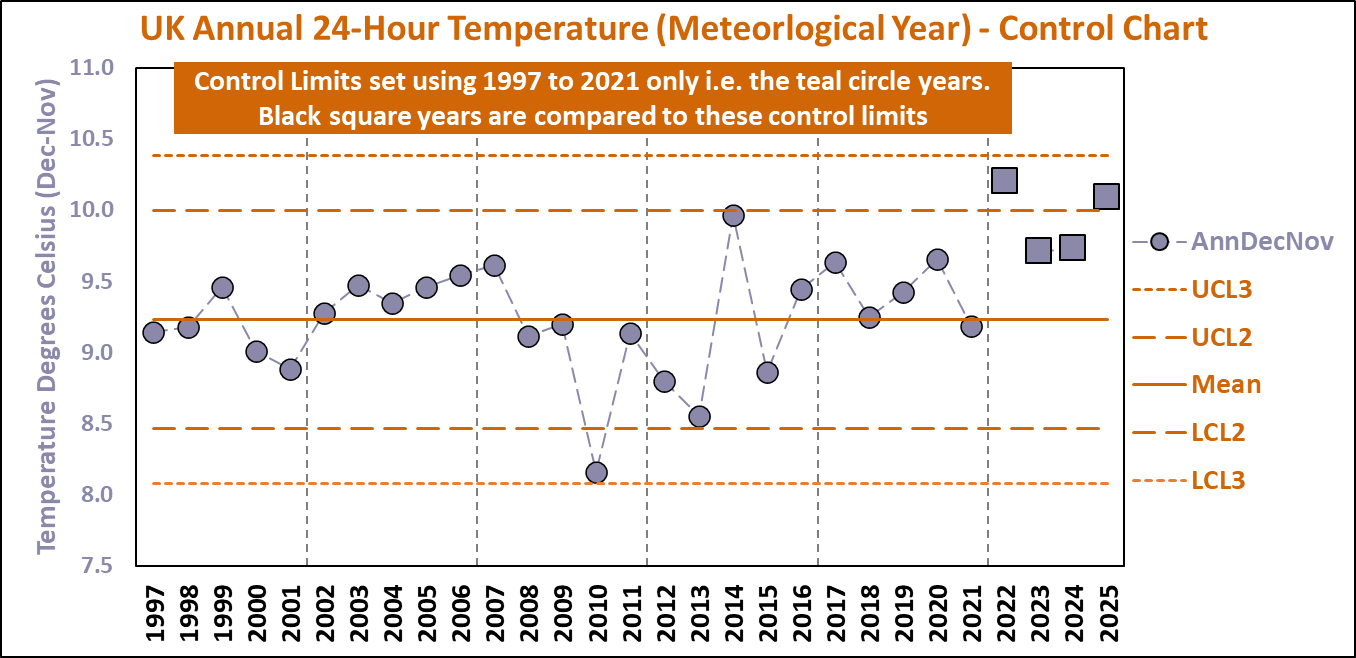
M2 – Control Chart for UK 24-Hour Temperature – Meteorological Year
The control chart for the period 1997 to 2025 is shown below with these control limits. As for calendar years, the control limits are based on the years 1997 to 2021. The numbers in brackets show the difference from the control limits used for calendar years.
- UCL3 = Upper Action Limit = 10.38 (-0.08)
- UCL2 = Upper Warning Limit = 10.00 (-0.07)
- Target = Long Term Average = 9.23 (-0.04)
- LCL2 = Lower Warning Limit = 8.46 (-0.01)
- LCL3 = Lower Action Limit = 8.08 (+0.01)
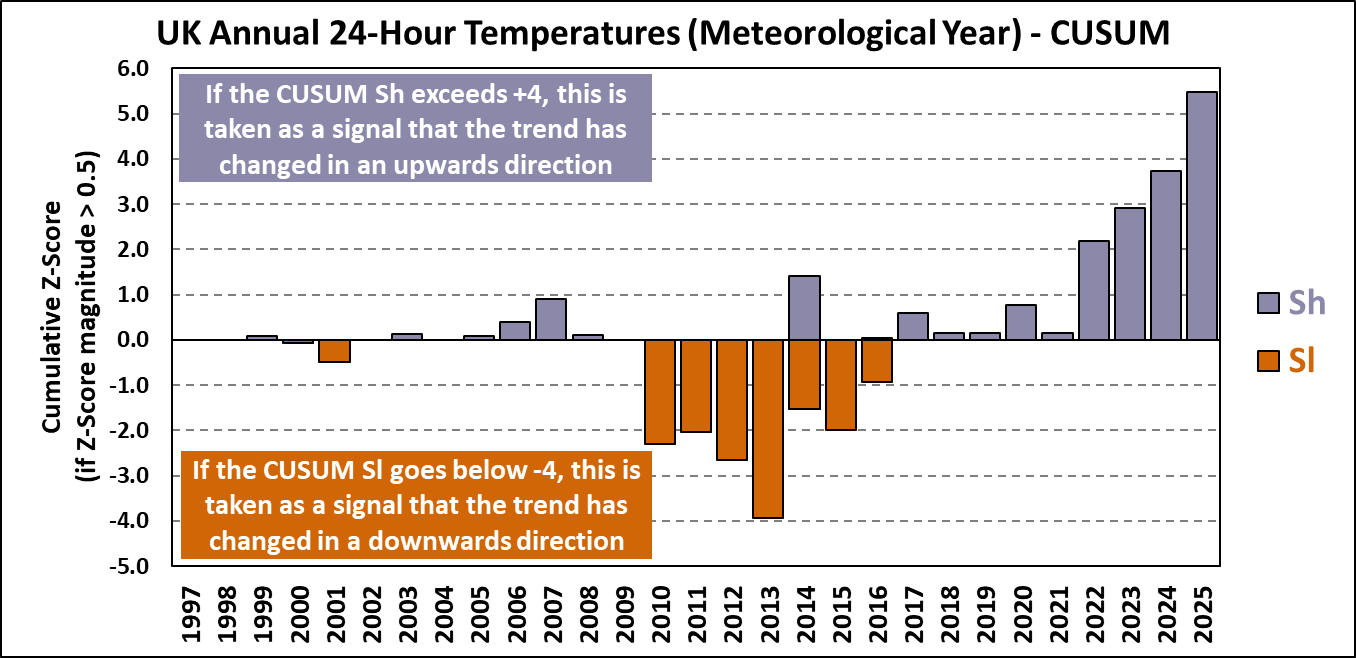
M3 – CUSUM chart for UK 24-Hour Temperature Trends – Meteorological Year
When I use meteorological year data in the CUSUM chart below, I find that in 2025 Sl is 0 and Sh is +5.5.
Has a new warming trend begun?
It is still the case that SPC rule 4 (8 successive years above the target value) has been met for calendar years (for 10 years in fact) but not for meteorological years. What’s changed in 2025 is that both CUSUM charts show a definitive upward trend.
Until now, whilst I have been happy to conclude there has been a step change upward in the temperature level, the nature of any new trend was unclear to me. With the CUSUM signals, I now observe the upward trend as measured by the 11 year centred moving average is similar to that observed between 1982 & 2002. Back then, over a 21 year period, UK 24 hour temperatures rose by 1.17 degrees according to the 11 year CMA or 0.056 degrees per year. Between 2013 & 2020, the 11 year CMA has increased by 0.46 degrees or 0.066 degrees per year.
Does that mean temperatures in the UK will repeat what happened at the end of the 20th century? I have no idea since I am not a meteorologist. All I observe is the trends are similar today as they were then. What I will continue to do is monitor the trends and update this article every year using the tools to SPC to decide if the trends are stable or changing. This means one issue I will have to address next year is whether to change the control limits I use in my charts given that those based on 1997 to 2021 no longer seem to apply.
If you want to read my other Weather Trends posts, please click on the link or the Weather Trends hashtag below this post. Otherwise, please click the relevant season from the list below.
- 2025 – Winter, Spring, Summer, Autumn, Annual
- 2024 – Winter, Spring, Summer, Autumn, Annual
- 2023 – Winter, Spring, Summer, Autumn, Annual
- 2022 – Winter, Spring, Summer, Autumn, Annual
- 2021 – Winter, Spring, Summer, Autumn
- 2020 – Winter, Spring, Summer, Autumn
- 2019 – Winter, Spring, Summer, Autumn
- 2018 – Winter, Spring, Summer, Autumn
- 2017 – Winter, Spring, Summer, Autumn
