In two weeks time, the UK will vote in its 3rd general election in less than 5 years. After serious polling errors in the last 3 general elections, it is understandable that everyone is taking the latest figures with a lot of salt. As it stands today, the polls are telling us that the Conservatives have more or less recovered their 2017 standing but Labour is still a long way from repeating their 2017 performance.
Summary
Since the summer of this year, I have been recording the vote shares for national totals plus some crossbreaks (where available) from these 10 pollsters :- BMG, Comres, Deltapoll, ICM, Ipsos-Mori, Kantar-TNS, Opinium, Panelbase, Survation & YouGov. Prior to the election, I recorded the last available poll from each pollster in each month. Since the election was called, I have recorded the latest poll within each week with a week defined to be Thursday to Wednesday. Which week a poll falls in is based on the last day of fieldwork.
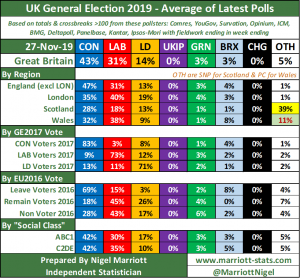

I will explore each level of these tables in separate sections further down but here is my reading of the big picture presented by these polls.
The question everyone is asking themselves is whether the outcome of the 2019 election will be different from 2017. Will we have another hung parliament or will the Conservatives get an overall majority? No other outcome is being seriously suggested so in this post, I am going to focus on what needs to change from 2017 for there to be a different result in 2019 in the form of a Conservative majority.
The top line picture is that at the national and regional levels, the Conservatives are essentially matching their 2017 vote share. If this is where they remain come election day, then they will only get a majority if either they can redistribute their votes efficiently e.g. from safe seats to marginals, or if the Labour vote is down on 2017. For the first scenario, we will need to see if the Conservatives are maintaining their 2017 vote share in all categories or if they are gaining in some categories and losing in other categories. The data suggests the latter is the case but at present it is not clear if the redistribution is efficient.
It may be the case that the Conservatives don’t need to worry about the efficiency of voter redistribution since Labour is currently 9 to 15 points down on 2017. However, we all remember how Labour closed a similar gap in the last 2 weeks in 2017 and the polls will be keenly watched between now and 12th December for signs of this happening again. The question to be answered is from where will Labour recover those lost votes? The data makes clear that for most part, it is about those who say they will vote Lib Dem which opens up the whole issue of tactical voting and how large a part this will play.
Great Britain
I’ve decided to plot all the latest trends for all categories against known data for previous elections back to 1974. There is no question that Boris Johnson has managed an impressive recovery in the polls since taking over from Theresa May and the chart makes it clear that the majority of the recovery has been due to Brexit party voters switching to the Conservatives.
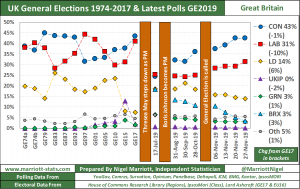
Labour’s recovery since then has been much more modest and this due mostly to the stubbornness of the Lib Dem vote. After two miserable elections, the Lib Dems are back at the low end of the range they occupied between 1974 & 2010.
Both the Greens and the Brexit Party (as a replacement for UKIP) are up on 2017 but I think their actual vote shares on election day will be the same as 2017 as their voters make tactical voting decisions. The question will be which parties will benefit from those decisions.
By Electoral Region – England (excl London)
In 2017, I was badly bitten by polling errors in my attempt to track voting intentions by each of the 8 English electoral regions. For the 2019 EU Parliament elections, I decided it was better to track vote intentions for England as a whole excluding London and then use historical regional variations between the parties to allocate votes to each region. I felt that worked quite well hence my decision to do the same for the general election.

At the moment, my comments on the GB trends pretty much apply to EnglandXL (as I label it) in their entirety.
I should note that I record the vote shares for EnglandXL by breaking out the relevant crossbreaks from each pollster’s poll. EnglandXL accounts for 460 of the 650 seats in parliament so sample size is not an issue for this crossbreak. 6 pollsters give crossbreaks for London so allowing London to be split off from England.
By Electoral Region – London
For other electoral regions, I am only recording pollster crossbreaks whose weighted sample size exceeds 100 which is the case for 6 pollsters. However, YouGov also carry out an exclusive poll in conjunction with Queen Mary University of London with a much larger sample. When this occurs, I give this poll 5 times the weight of any crossbreak. For the latest week, YouGov actually ran a much large sample for their MRP model and it is this data that has been given 5x weight instead. The QMUL poll was last run in 1st week of the election so the two intervening weeks are solely crossbreaks and thus less reliable.

The key issue in London is that Labour is doing much worse and the Lib Dems much better than elsewhere. At the moment that must be beneficial to the Conservatives despite London being a Remain city. What is especially notable is that Labour has not made any advances since the election was called. Instead, there appears to be a small swing from the Lib Dems to the Conservatives. It is fair to say that London is on the frontline of the battle for Remainers who don’t want Brexit but don’t want Jeremy Corbyn as Prime Minister either. Which is the lesser evil for them?
It should be noted that London has seen a number of constituency specific polls carried out by Deltapoll and Survation. I have recorded this data but have not analysed it yet.
By Electoral Region – Scotland
In terms of data, Scotland is similar to London in that most crossbreaks are large enough to be recorded and better quality data is also available from Scotland specific polls carried out by Panelbase. In fact this week has seen 3 large samples for Scotland with both Ipsos Mori and YouGov MRP supplementing Panelbase. The first 3 weeks of the campaign had to rely on crossbreaks.

The SNP is dominant in Scotland but at the moment, it doesn’t look like they have made any significant gains since 2017. They may still benefit from the fact that Labour is down whilst the Lib Dems are up. The one thing to note is that almost no-one is intending to vote Green or Brexit so from now on, vote switching will have to take place among the top 4 parties.
By Electoral Region – Wales
Unlike Scotland & London, most Welsh crossbreaks are too small to be recorded. Therefore the chart below is mostly based on the Welsh Barometer poll carried out by YouGov. This took place this week and last occurred in the 1st week of the campaign. The intervening two weeks are from one or two crossbreaks.

The most notable factor about Wales is the large intended vote for the Brexit Party of 8%. With the Conservatives already close to their 2017 vote share, persuading these voters to switch has to be their priority especially with Labour well down on 2017. At the very least, the Conservatives need to prevent them from voting Labour and if that happens, they can gain seats.
By GE 2017 Vote – Conservatives
My charts for GE17 & EU16 all use Lord Ashcroft data to derive the data for GE17 & GE15, notably his large post-GE17 poll which allowed GE17 voters to be split according to whether they also voted in 2015 & 2016. In this chart, by definition since we are looking at everyone who voted Conservative in 2017, the scale is 100% for GE17.
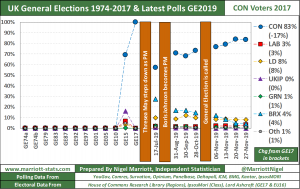
This chart shows us that 70% of CON17 voters had previously voted Conservative in 2015 which means 30% came from elsewhere. Some will have been new voters in 2017 but most were former UKIP voters (16%) plus about 5% each from Labour & Lib Dems.
When Johnson took over from May, only 60% were planning to vote Conservative but that figure is now back to 83%. The bulk of that has come from the Brexit Party where the 27% of CON17 who were planning to vote BRX is now down to 4%. Whilst Johnson will still hope to gather up the remaining 4%, he has succeeded in the first step of recovering most of these voters. At the same time, he has reduced the leakage to the Lib Dems, who are in 2nd place in quite a few seats in the South, from 10% to 8%. As yet there is no sign of significant defections to Labour.
By GE 2017 Vote – Labour
Since the Conservatives are more or less back to 2017 levels but have only recovered 5 out of every 6 CON17 voters, this tells you that the Conservatives are draining voters from other parties. Most notable is the latest figure in this chart which shows that 9% of LAB17 voters plan to vote Conservative this time compared to only 2% when Theresa May stood down.
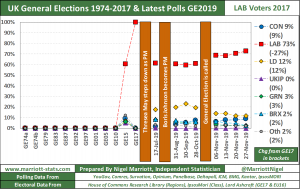
These are either Labour Leavers that Theresa May failed to capture in 2017 or are UKIP15 to LAB17 switchers. I have written before that I am convinced that the level of UKIP to Labour switching in 2017 was larger than people think. If that is the case, then capturing them should be easier given how Labour’s Brexit policy has developed since then.
The larger problem for Labour is the 1 in 8 LAB17 voters who plan vote Lib Dem. Are these defectors completely lost to Labour or can then be encouraged to vote tactically for Labour? Since the election was called, Labour has managed to draw back some of these defectors but the scale is less than what the Conservatives have managed with their BRX defectors. Over the next two weeks, the challenge will be to claw back more of the Lib Dem defectors whilst not losing more defectors to the Conservatives or vice versa. I am not sure Labour can claw back both sets of defectors since in all probability, these defectors are on opposite sides of the fence when it comes to Brexit.
By GE 2017 Vote – Liberal Democrats
The Lib Dems are currently polling about double where they were in 2017. They are taking voters from both Labour and the Conservatives but they have also been losing 30% of their 2017 voters. That points to extreme volatility in their voters. It is striking that only 50% of their 2017 voters had previously voted for them in 2015 yet the Lib Dem vote share was virtually the same in both elections. So whilst losing 30% is a lot, it isn’t as large as 2017 which suggests a slightly stickier Lib Dem vote this time.
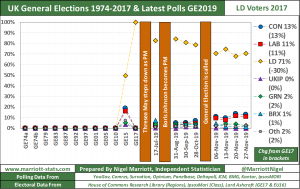
The voters they have lost are broadly splitting equally between the Conservatives and Labour. That means that the CON17 & LAB17 that the Lib Dems have been pulling in will be partly offset by the losses.
All in all, the bottom line is that whatever movements take place in the Lib Dem vote, the effect om Labour and Conservatives is currently balanced out. What will matter is whether that balance is repeated at the constituency level and if not, which party gets the benefit?
By EU 2016 Vote – Leavers
As I stated earlier, the data shown here for GE15 & GE17 comes from the Lord Ashcroft post GE17 poll. It’s important to note that Leavers here are not all those who voted Leave in 2016, it is those voted Leave in 2016 AND voted in GE17. Turnout in 2017 was 3.5 pts lower than 2016 which means we have Leave voters who did not vote in 2017. I am basically making the assumption that they will not vote in 2019 as well.

Two big changes are apparent. When Johnson became PM, 40% of these Leavers were intending to vote for the Brexit Party whilst for Conservatives and Labour, the figures were 33% & 12% respectively. Today, only 8% plan to vote BRX whilst 69% will vote Conservative and 15% Labour. Given that 25% of these Leavers had voted Labour in 2017, that in a nutshell explains why the Conservatives enjoy the lead they have at the moment over Labour. If Labour wants to close the gap like they did in 2017, they have to get those 10% of Leavers back. Recent reports in the news indicate that Labour is fully aware of that and the polls next week will tell us if that has been successful.
By EU 2016 Vote – Remainers
Labour took 50% of the Remainers who voted in both 2016 & 2017 and are back to 45% after dropping to 30% at one point. The point is though they have yet to exceed their 2017 performance with Remainers whereas the Conservatives have already exceeded their 2017 performance with Leavers.

The Conservatives are down among these Remainers by 7 points from GE17 but that of course has been cancelled out by the 9 pt gain since GE17 among Leavers. For me, this is the key statistic that confirms that the CON17 vote whilst matching 2017 levels is being redistributed from Remainers to Leavers. The efficiency of this redistribution will be key to determining their chances of an outright majority even if Labour do manage to claw back some of their Lib Dem defectors. I’ve yet to do the analysis but I want to see which of these two situations is closer to the truth.
- Remainers are defecting from the Conservatives in Tory held marginals whilst Leavers are moving to the Conservatives in safe Labour seats.
- Remainers are defecting from the Conservatives in safe True Blue seats whilst Leavers are moving to the Conservatives in Labour marginals.
The former will deny the Conservatives a majority if Labour do make gains over the next two weeks and could still make things tricky even without Labour gains. The latter gives the Conservatives their majority even if Labour stage a comeback of some sort. The seat by seat analysis here could be extremely interesting!
By “Social Class” – ABC1
The last two charts uses Ipsos-MORI data for historical estimates of how “social classes” voted in elections between 1974 & 2017. This is a long running series but it is important to understand that the definition of class is not self-identity, it is based upon a standard definition using occupation for the most part and has been widely used for decades. What you have to careful of though is calling ABC1 “Middle Class” and C2DE “Working Class”. A recent piece of work by YouGov shows that they correlate with personal class identify quite poorly.

That does not stop them from being useful categories. When it comes to ABC1, this has always been a Conservative demographic until the Labour landslide of 1997 when the gap narrowed. Since then, the Conservatives have struggled to reclaim their dominance of ABC1s and Labour in fact had their best ever performance in 2017.
So far this year, the Conservatives have been able to open up a larger gap than 2017 though they are not yet back to 2017 levels. The good news for them is that it appears that Lib Dem ABC1s have moved to the Conservatives since the summer rather than to Labour. That could bode well for their seats in well-off areas that are under threat from the Lib Dems. Yes their majority may well be cut but these seats are often safe true blue.
Labour have also made gains since the summer but are well down on 2017. Their gains appear to have come from the Green party. Since the summer, Labour is up 7 points whilst the Greens are down 5 points.
By “Social Class” – C2DE
In 2017, I predicted history would be made with the Conservatives winning the C2DE vote for the first time ever. In the event the 4pt underestimate of the Labour vote undid that but today the polls show a clear win for the Conservatives.

This demographic is known to be a Leave voting segment but it is striking that over the last couple of weeks, Labour is up about 5 points whilst the Brexit party is down 5 points. This takes us back to the 2017 dynamic that I am convinced is underestimated whereby UKIP15 voters became LAB17 voters. This is the battle I am watching very closely because this is where the Labour comeback could materialise especially in the Northern Labour seats that the Conservatives are targeting. These are seats with few Lib Dems & Greens in the first place to cast tactical votes so attracting the Brexit party supporters will be key. Whether they can do it is another matter.
My Seat Forecast for GE17
This will be published in a separate post but I am still in the process of doing the modelling. I expect to tweet my numbers early next week and publish a full forecast on my blog on Tuesday 10th December.
If you are interested in how I will make my forecasts, I expect to follow the methodology I explained in this tweet earlier this year.
— Want to Comment on this Post? —
If you would like to comment on this post and others listed further down, you can do so on these twitter threads.
- My thread linked to this post
- The same charts as this post but for week ending 20th November 2019
- Some thoughts on the effects of UKIP stand downs in 2017
- Some thoughts on what the Brexit Party needed to do to make a breakthrough
- Some thoughts from Jan 2019 on what Labour have to do to get a majority
— More Posts about Opinion Polls —
Since the 2017 General Election when my forecast was undermined by yet another polling failure, I have written a number of posts about the long term accuracy of opinion polls and these are listed below:-
- How should pollster house effects be accounted for? (see 2nd half of the post)
- How accurate are the opinion polls in the UK?
- Who is the most accurate pollster in the UK?
- Do UK pollsters show forecasting skill?
- My Welsh Barometer Poll forecast was a success!
To see my previous Opinion Poll Trackers, please click the relevant month below.
